
Figure 3.
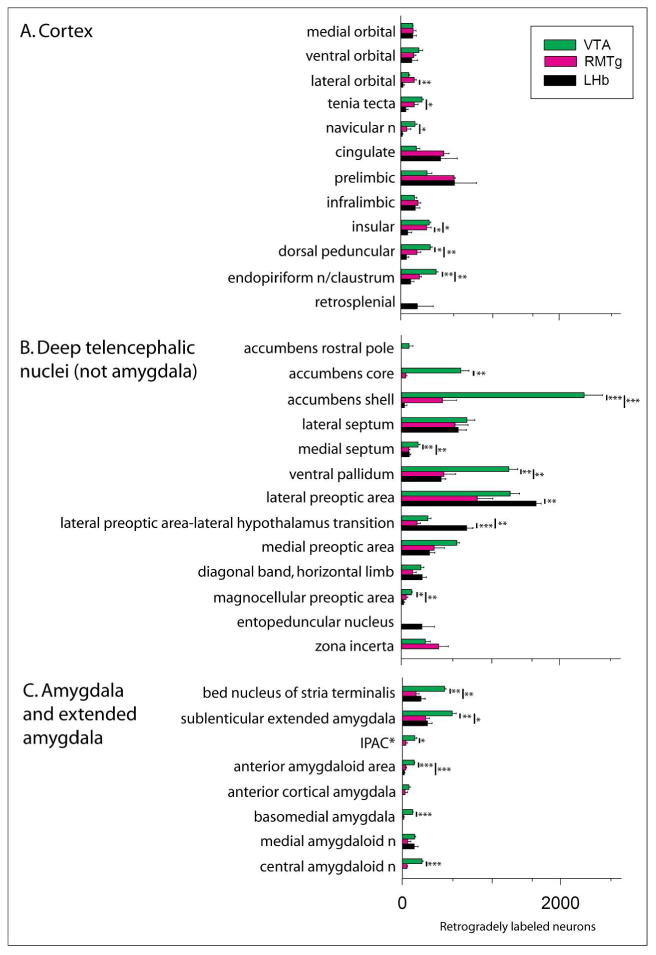
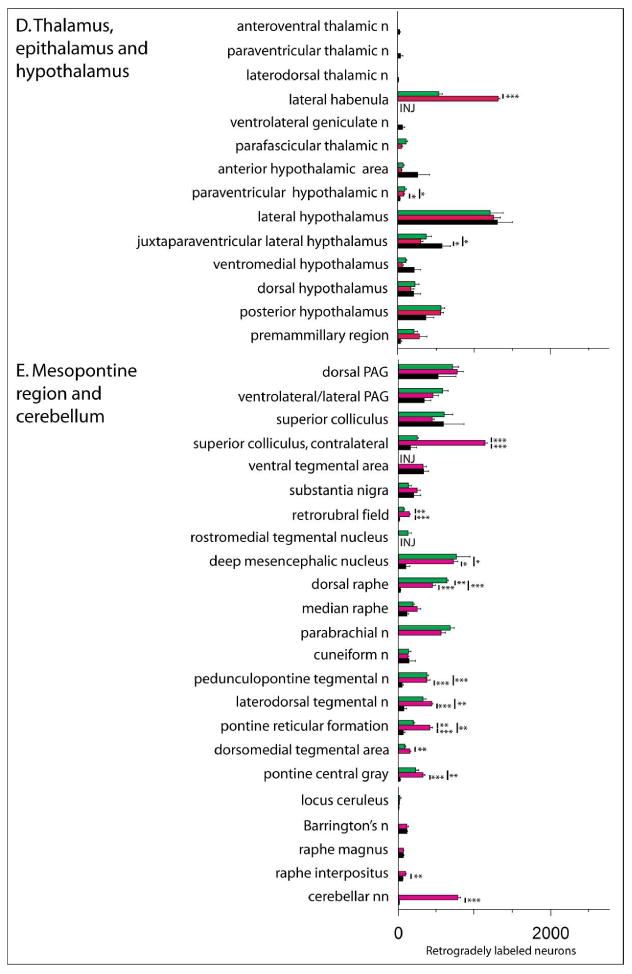
Bar graph illustrating the means± SEM of numbers of retrogradely labeled neurons counted in structures throughout the brain following injections of cholera toxin β subunit (Ctβ) into the ventral tegmental area (VTA, green bars), rostromedial tegmental nucleus (RMTg, magenta bars) and lateral habenula (LHb, black bars). The structures under each subheading (A. - E.) are listed in approximately rostrocaudal order. * - IPAC is interstitial nucleus of the posterior limb of the anterior commissure. Vertical bars with asterisks indicate statistically significant differences with *, **, and *** indicating p < 0.05, p < 0.01 and p < 0.001, respectively (Tukey's posthoc tests). Results of ANOVAs are given in Table 3