
Figure 7.
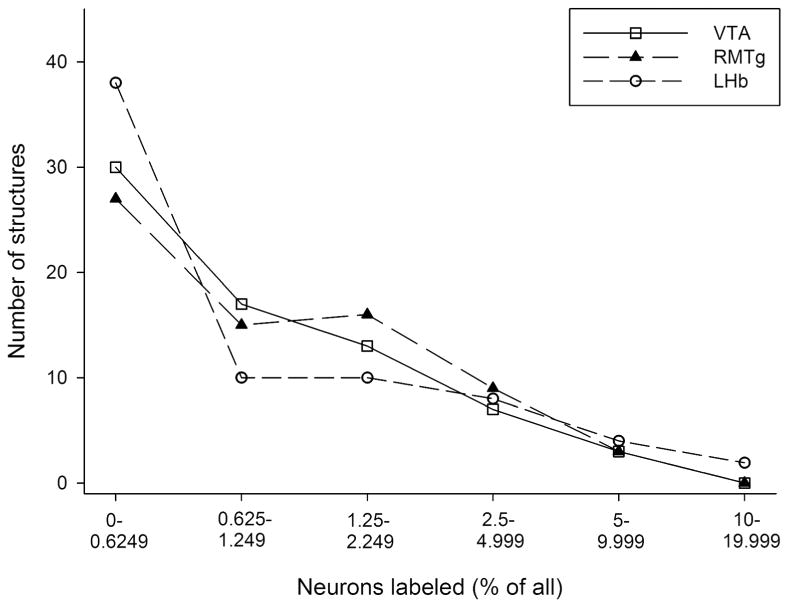
Frequency histogram (presented as a line graph) showing how much of the retrograde labeling (binned on the abscissa as percent of total labeling) was present in how many of structures (ordinate, total is 70, i.e., all the structures listed in Fig. 3) following injections of tracer into the ventral tegmental area (VTA - open squares), rostromedial tegmental nucleus (RMTg - closed triangles) and lateral habenula (LHb - open circles). Note that many of the structures had minimal labeling (less than 0.625% of total) following all of the injections, whereas most of the other structures were contained in the bins representing sparse to moderate labeling (e.g., 0.625-5%). A remaining small minority of structures, which, of note, were different for each of the three injection sites (see Tables 5 and 6) exhibited a substantial amount of labeling (e.g., 5% or more).