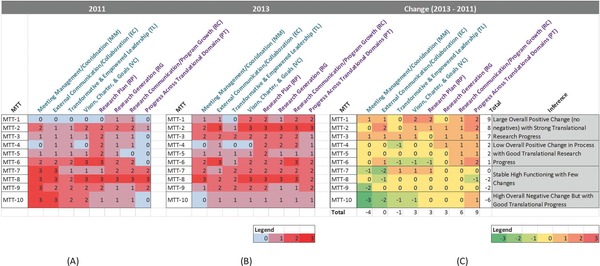
Figure 2.

Sorted heatmaps showing the eight consensus scores (four process and four outcome) of 10 MTTs in (A) 2011, (B) 2013, and (C) the change in scores between 2011 and 2013. The sorted heatmaps revealed four categories of change across the MTTs. See Case Studies and Table 1 for additional details.
