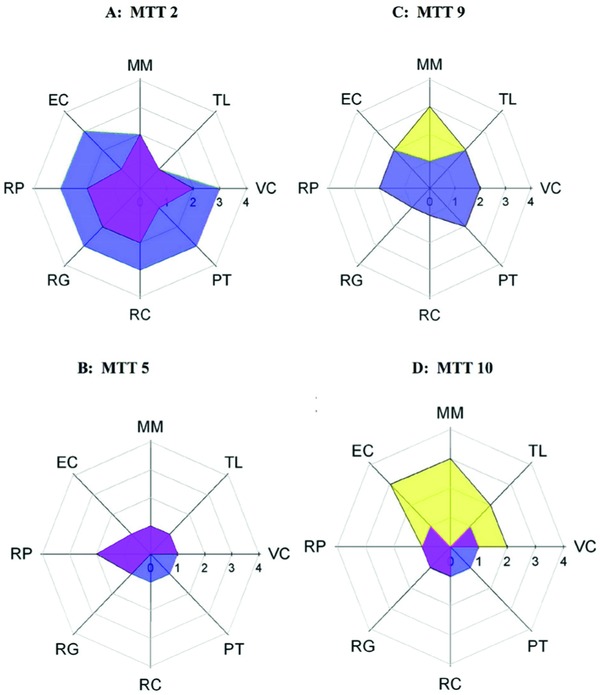
Figure 3.

Radar graphs depicting eight team variables (four outcome and four process) of four exemplar teams. Axes represent four research output factors and four team process factors. Outcomes are (clockwise from 10 o'clock) PROCESS: EC = external communication/collaboration; MM = meeting management; TL = transformative leadership; VC = vision and charter; RESEARCH: PT = progress in translation; RC = research communication and program growth; RG = research generation; RP = research plan. For other details, see Table 1. Data from 2011 are shown in yellow and data from 2013 are shown in purple. Areas of overlap, which represent outcomes that have been maintained or improved in 2013 versus 2011, are shown in magenta.
