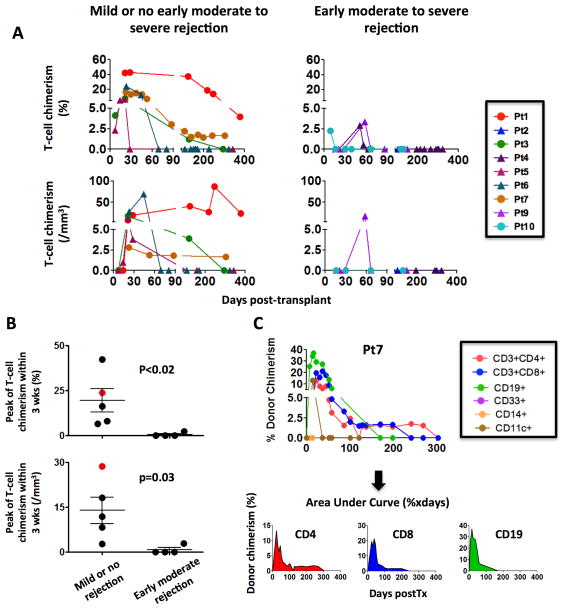
Figure 3. Analysis of T-cell (CD3+) chimerism over time in MVTx and iITx recipients according to the occurrence of an early moderate to severe rejection episode.
(A) Patients free of significant rejection had higher T cell chimerism both in frequency and absolute number. Circles and triangles indicate MVTx (Pts 1, 3, 7 and 10) and iITx (Pts 2, 4, 5, 6, 9) recipients, respectively (B) The early (within 3 weeks) peak of T-cell chimerism was significantly higher in the patients without moderate rejection. Pt6 (red dot), who experienced skin GVHD episode from day 46 to 54, displayed the highest absolute count of circulating donor T cells at 3 weeks. (C): Calculation of overall chimerism (Area Under Curve) by integrating the donor chimerism frequency over time.
Abbreviations: Pt, patient; wks, weeks

