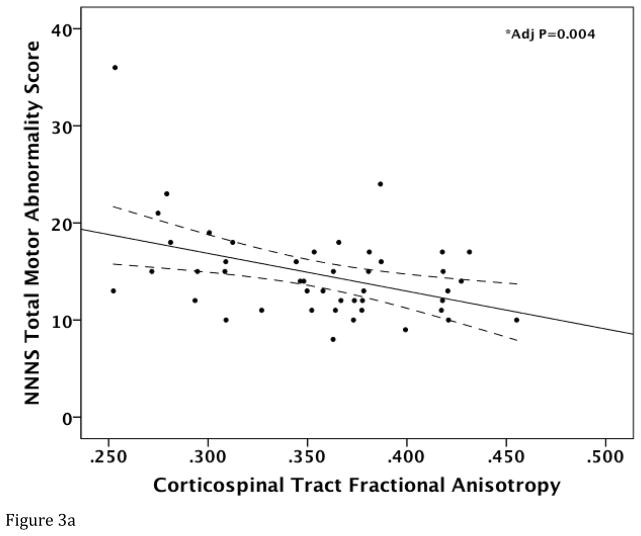
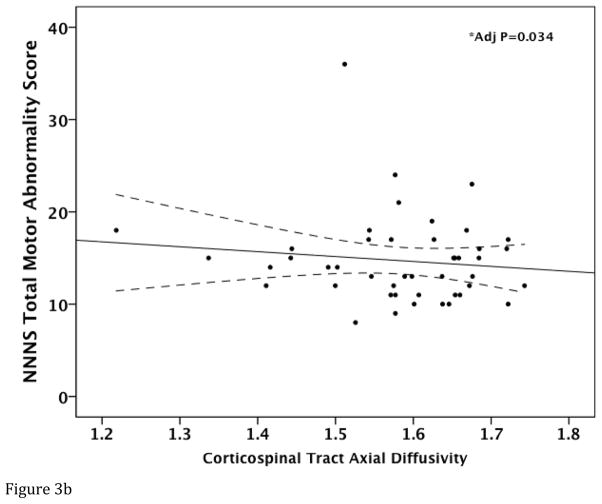
Figure 3.
Relationship between Total NNNS Motor Abnormality Score and corticospinal tract DTI measures. Raw data scatter plots are presented with unadjusted regression line and 95% confidence intervals (dotted line) for (A) fractional anisotropy and (B) axial diffusivity. *Denotes significant P value after adjusting for covariates.


