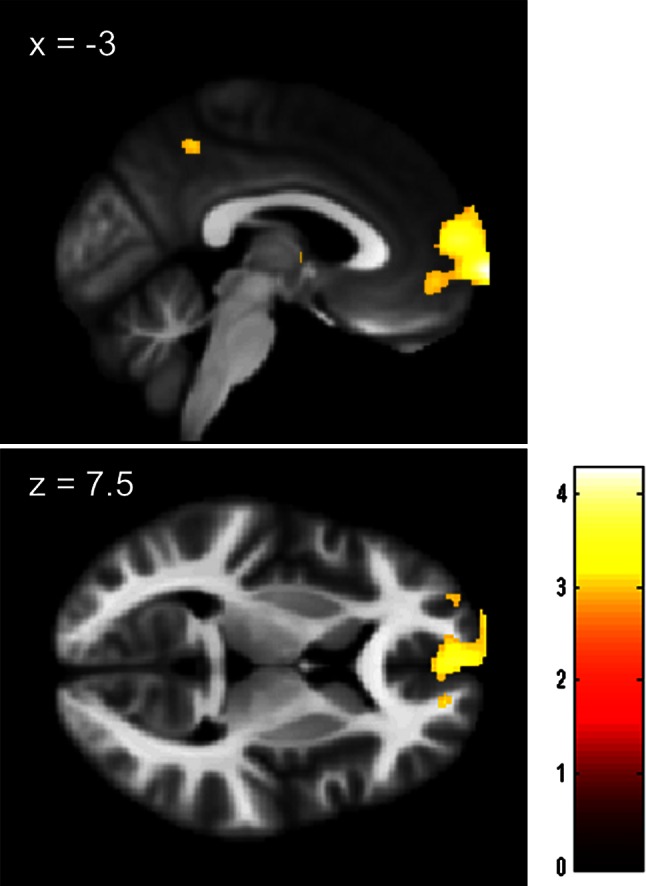
Fig. 1.

Maps showing larger rGMV in science students than in humanities students. The results are presented at a threshold of P < 0.0025, uncorrected, on a skull-stripped image created from the averaged normalized T1-weighted structural images of a portion of the subjects included in this study. The region of significant difference is visible in an anatomical cluster that spreads through mPFC and the frontopolar area. The intensity of the color represents the T score
