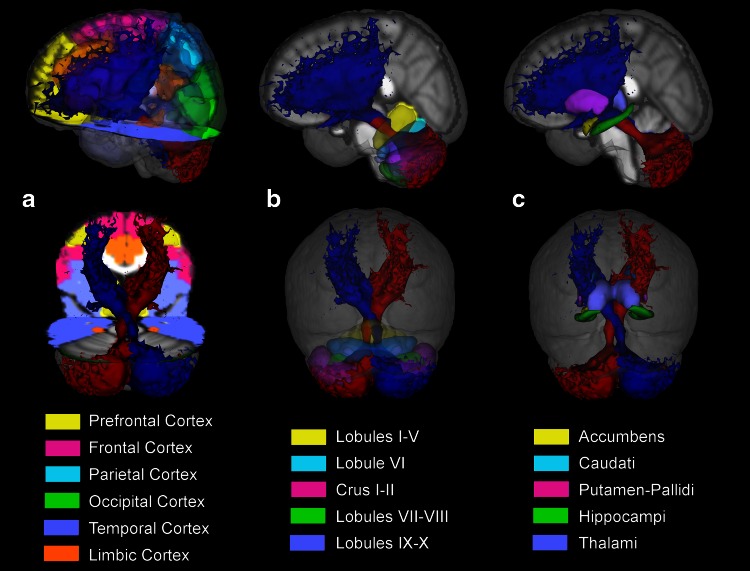
Fig. 5.
Tridimensional view of the average cerebello-thalamo-cortical pathway across all subjects in MNI space. Cerebral (a), cerebellar (b) and deep grey matter (c) atlases are overlaid to assist visualization of cerebellar connections. a Distribution of left (red) and right (blue) tracts in the cerebral cortex: the reconstructed tracts reach the prefrontal (yellow), frontal (fuchsia) and temporal (violet) cortices with greater density of streamlines. b Streamlines distribution in the cerebellar cortex: the lateral Crus I–II (fuchsia) and the lateral lobules VIIb/VIII (green) are showing the greatest density of tracts. c Streamlines distribution of deep grey matter nuclei: the thalami (violet), the caudate (light blue) and the putamen (fuchsia) show the greatest trGMcROI

