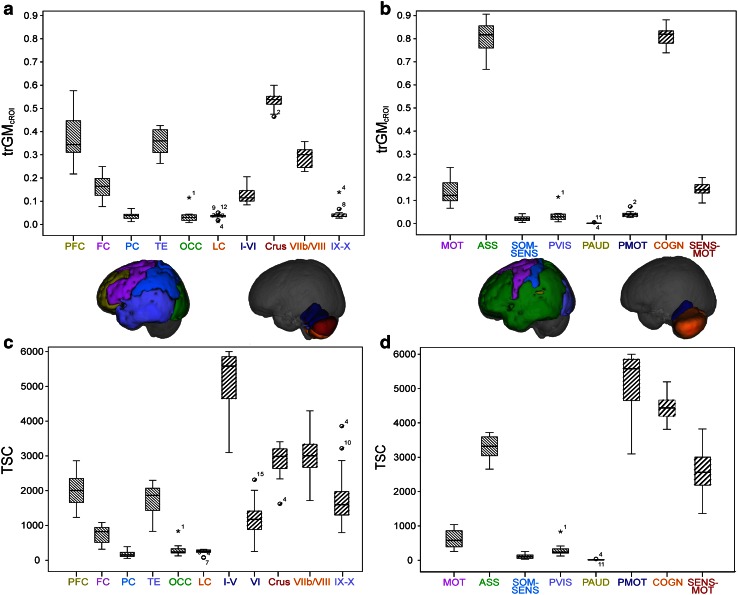
Fig. 7.
Histograms of mean values of trGMcROI and TSC for each region of the cerebral cortex and of the cerebellar cortex. PFC prefrontal cortex, FC frontal cortex, PC parietal cortex, TE temporal cortex, OCC occipital cortex, LC limbic cortex, MOT motor, ASS associative, SOM-SEN somatosensory, PVIS primary visual, PAUD primary auditory, PMOT primary motor, COGN cognitive/sensory, SEN-MOT sensory motor. a trGMcROI values of all cerebral and cerebellar regions created on anatomical bases. PFC and Lateral Crus I–II have the highest values in cerebrum and cerebellum, respectively. b TSC values of all regions created on anatomical bases. PFC and lobules I–V have the highest values in cerebrum and cerebellum, respectively. c trGMcROI values of all regions created on functional bases. ASS and COGN areas have the highest values in cerebrum and cerebellum, respectively. d TSC values of all regions created on functional bases. ASS and PMOT areas have the highest values in cerebrum and cerebellum, respectively

