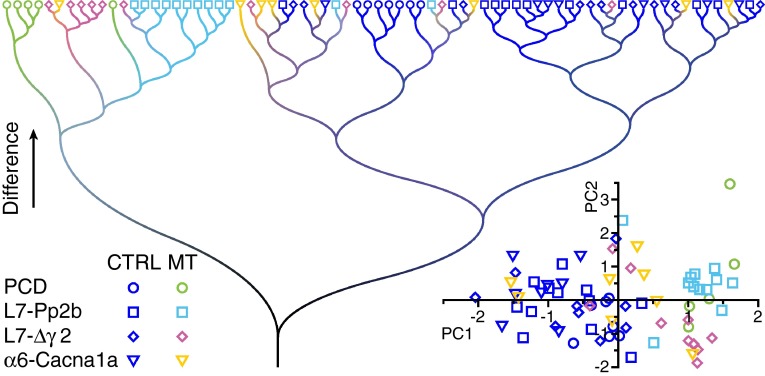
Fig. 12.
Cluster analysis reveals unique locomotor phenotypes for cerebellar mutants. In a cluster analysis on the locomotion parameters at session 5 (see “Materials and methods”) the Pcd, L7-Pp2b and L7-Δγ2 mutants form clear clusters indicating that each of them has a unique phenotype on the Erasmus Ladder. The α6-Cacna1a mice were largely interspersed between the control groups, in line with our findings that they only showed deficits at specific parameters, mostly correlated to obstacle crossing and interlimb coordination. The individual control groups were largely intermingled, indicating the absence of a systematic bias between the control groups. Inset Principal component analysis of the same dataset (see “Materials and methods”). The axes show the first two principal components (in eigenvalues). The mutant and control mice segregate largely on the first (and thus most significant) principal component (PC1, x axis), whereas the different mutant groups cluster apart when also the second principal component (PC2, y axis) is taken into account. Also in this analysis, the α6-Cacna1a mice are less different from the control groups than the other three mutant mouse lines

