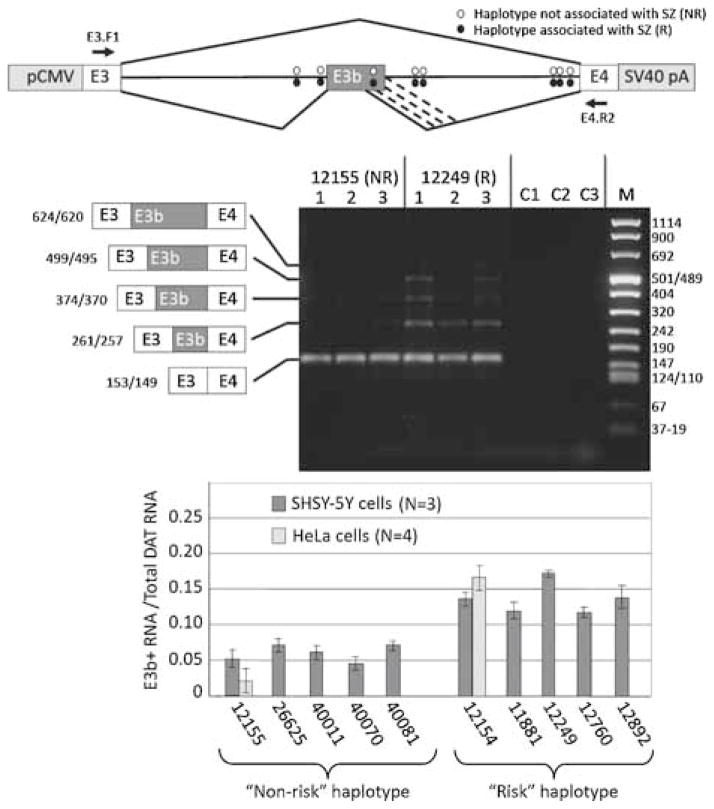
Figure 4.
Effect of putative schizophrenia-associated SNPs on splicing of E3b in cell transfection assays. Top panel: Structure of transfection constructs (not drawn to scale; details in text). pCMV: promoter and transcription start site from CMV. SV40 pA: 3′ cleavage/polyadenylation cassette from SV40. Constructs contain the entire 9 kb intron 3 sequence; thus, RT-PCR with the indicated primers (location shown by arrows) only detects processed transcripts. The positions of the SZ-associated SNPs within intron 3 are shown by ovals. Diagonal lines indicate the alternative splicing events identified by RT-PCR analysis, including the use of alternative 5′ splice sites for E3b (the alternative 3′ splice sites for E3b are only four nt apart and are not distinguished in these experiments). Middle panel: Examples of transfection results showing a non-PITT risk-associated (12155) and a risk-associated (12249) construct expressed in SH-SY5Y cells. RNA was isolated from each of three transfection replicates for each construct and analyzed by reverse transcription with random hexamers followed by PCR with primers E3.F1 (within SLC6A3 exon 3) and DAT.E4.R2 (within SLC6A3 exon 4) (arrows in top panel). Amplimers were separated on 2% agarose and stained with GelStar (Lonza). Identities and sizes of bands corresponding to alternatively spliced isoforms are indicated at the left (not drawn to scale; sizes correspond to use of the first or second 3′ splice site of E3b). Sizes of molecular weight markers (M) are shown at the right. C1: 12155 transfection, -RT control. C2: 12249 transfection, –RT control. C3: RT-PCR of RNA from untransfected cells. Bottom panel: Quantification of E3b alternative splicing in transfection experiments for five different “PITT risk” haplotype constructs and five different “non-risk” haplotypes. Gel images were captured digitally and analyzed using NIH ImageJ software. The vertical axis (E3b+/total) represents the proportion of total SLC6A3 mRNA that contains exon E3b, taking into account all the amplimer species corresponding to use of different 5′ splice sites for E3b. The average of three replicates and the standard deviation is shown in each case. Results are also shown from HeLa cell transfections for 12155 (“non-risk”) and 12154 (“risk”). Wilcoxon’s rank sum test indicated that the differences in average values for percent E3b inclusion between risk and non-risk constructs was significant at P < 0.005 (wnon-risk = 15, wrisk = 40). Analysis of variance showed that the differences in average E3b inclusion across the entire set of constructs were significant (F = 4.25, P < 0.01), whereas those among risk or non-risk constructs were not (Frisk = 0.938; Fnon-risk = 0.39; P ≫ 0.05 in both cases). Application of Student’s t-test to the pooled risk versus pooled non-risk data confirmed that inclusion of E3b was significantly higher for risk than for non-risk constructs (t = 5.85, P < 0.001).

