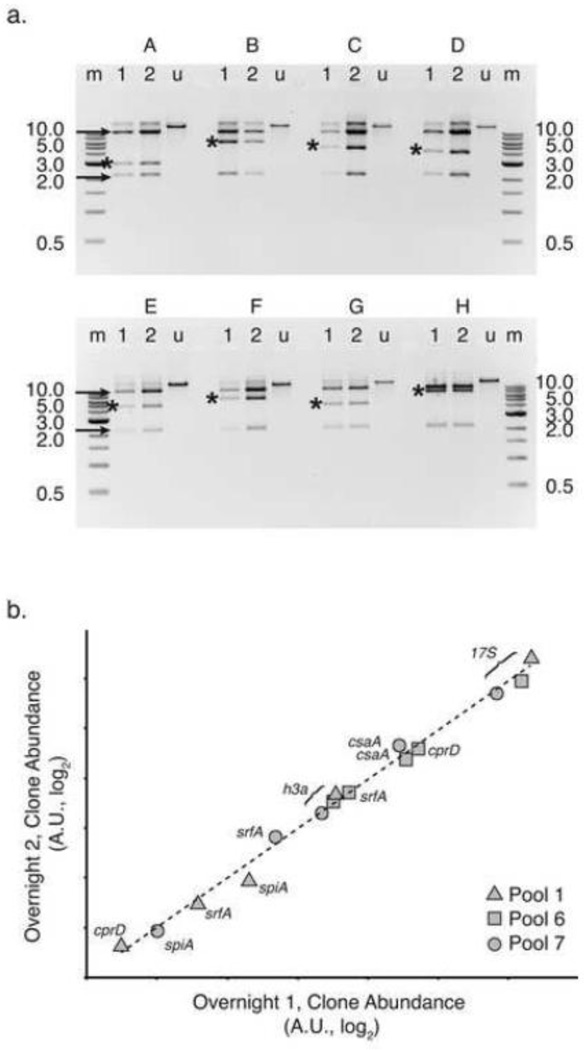
Figure 3. Cloned D. discoideum genomic DNA stably replicates in the library.
(a) We digested plasmid DNA purified from haphazardly selected library clones (A – H) with the restriction enzyme NotI. For each clone, plasmid DNA was sampled after growing overnight once (lanes “1”), or after a dilution was grown overnight for a second time (lanes “2”). Undigested plasmid DNA (lanes “u”) from the second overnight culture is shown as well. The 1-kilobase (kb) reference ladders (NEB, lanes “m”) are partially labeled with band sizes to the right and left of the image (0.5 – 10 kb). Black arrows indicate the long and short vector arms, while asterisks mark the insert genomic DNA fragment. The ratio of insert to vector band intensity, as determined by densitometry, is statistically indistinguishable between lanes 1 and 2 for each clone. DNA fragments were resolved by 0.8% agarose gel electrophoresis. Gels were stained with ethidium bromide and negative images are shown. (b) Using qPCR, we amplified marker genes from plasmid DNA isolated from entire library pools grown overnight for 1 or 2 serial dilutions. Cycle threshold (Ct) values were standardized to the kanamycin resistance marker aph, present on all plasmids in all pools. Relative gene abundance, estimated by log2 transformation of the standardized Ct value (2−ΔCt), is plotted for overnight growth 2 (y-axis) versus overnight growth 1 (x-axis). Both axes are log2 scale, with arbitrary units (A.U.). Targets from pool 1 are represented by triangles, pool 6 by squares and pool 7 by circles, as indicated in the legend. Genes h3a, srfA, and rRNA 17S were present in all three pools tested. Gene cprD was present in pools 1 and 6, while spiA was present in pool 1 and 7. The log-log best fit is shown as a dotted line (R2 = 0.99).

