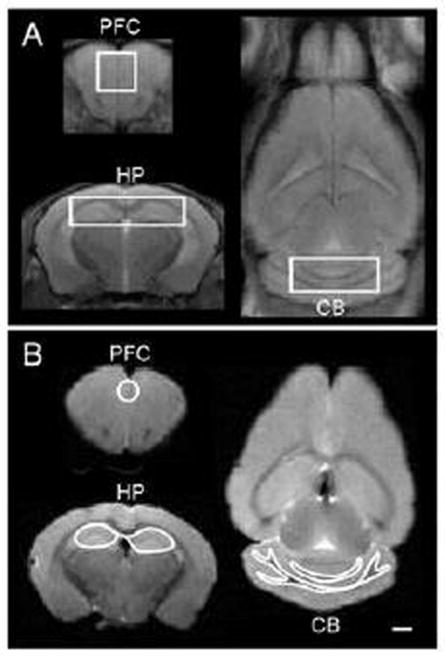
Figure 1.
A: In vivo proton-density-weighted MR images showing regions of interest (ROI) for in vivo 1H MRS experiments. B: Ex vivo proton-density-weighted MR images showing the placement of the brain regions of interest of DTI experiments. PFC = prefrontal cortex; HP = hippocampus; CB = cerebellum. Scale bar = 1 mm

