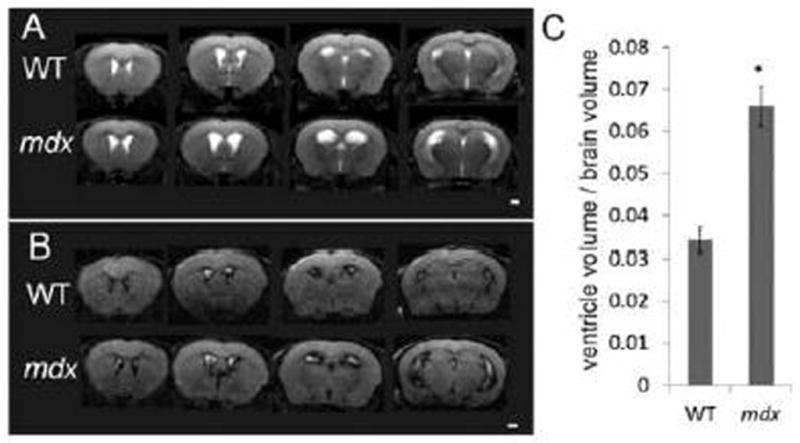
Figure 2.

A: Representative in vivo T2-weighted coronal MR images from a WT mouse (top row) and an mdx (bottom row) mouse. B: Representative in vivo fluid-attenuated inversion recovery (FLAIR) coronal MR images from a WT mouse (top row) and an mdx mouse (bottom row). Excess cerebrospinal fluid displayed by the high signal intensity (bright white) on the T2-weighed images (A) and low signal intensity (dark black) on the FLAIR images (B). C: Comparison of the ventricle/whole brain tissue volume from the T2-weighted MRI images between WT and mdx mice. Data are expressed as mean ± standard error, * p < 0.05 (p = 0.0001). Scale bar = 1 mm
