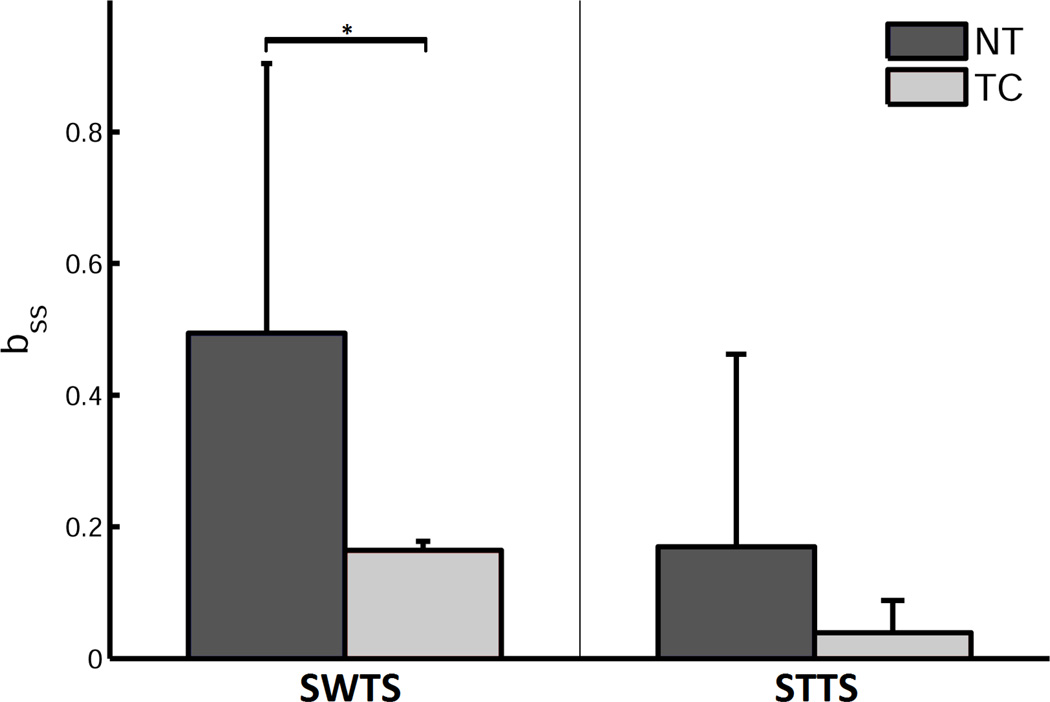
Figure 4.
The rate of change (bss) of the Swing Time Symmetry (SWTS) and Step Time Symmetry (STTS) indices for the two groups during the post-adaptation overground walking trials are shown. The smaller the bss value, i.e. value closer to zero, the smaller is the rate of change. Means ± SD are shown. * p < 0.05.

