Figure 5.
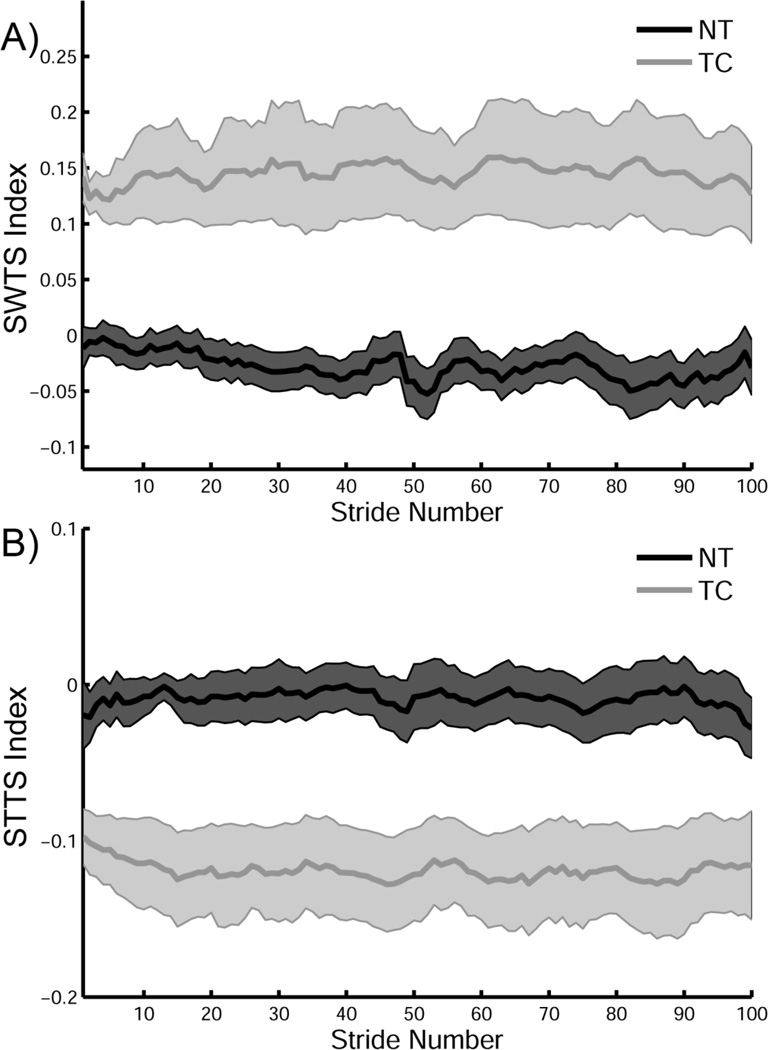
The effect of plantar tactile vibration for all the subjects on A) Swing Time Symmetry (SWTS) and B) Step Time Symmetry (STTS) indices during post-adaptation overground walking for all the subjects. The SWTS and STTS mean (dark line) and standard deviations (shaded region) are provided for all the subjects for 100 strides for the no-tactors (NT) group (dark gray) and the tactors (TC) group (light gray). Note the greater variability in the TC group across 100 strides.

