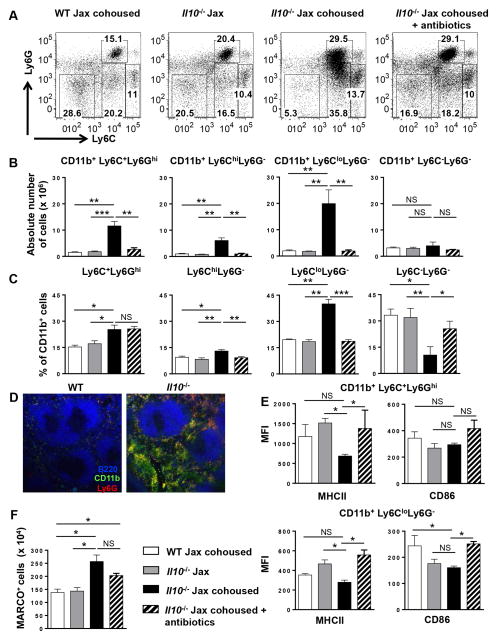
Figure 3. The increase in splenic CD11b+ myeloid cells in Il10−/− mice is due to increased numbers of monocytes/macrophages and neutrophils.
(A) Representative dot plots showing Ly6C and Ly6G expression by splenic CD11b+ myeloid cells from WT Jax cohoused, Il10−/− Jax, Il10−/− Jax cohoused (four weeks) and antibiotic treated (four weeks) Il10−/− Jax cohoused mice. (B) Using the indicated mice in (A) the absolute number of CD11b+Ly6C+Ly6Ghi, CD11b+Ly6ChiLy6G−, CD11b+Ly6CloLy6G−, and CD11b+Ly6C−Ly6G− cells was determined by flow cytometry. Data are shown as the mean ± SE of two experiments (n = 6–7). (C) The percentage of the indicated cell populations in (A) was determined by flow cytometry. (D) Immunofluorescence analysis of spleen sections from WT and Il10−/− mice stained with B220-Alexa Fluor 594 (blue), CD11b-Alexa Fluor 488 (green) and Ly6G-Alexa Fluor 647 (red) were performed. Representative images from one of two mice are shown (100x). (E) The expression of MHCII and CD86 on splenic CD11b+Ly6C+Ly6Ghi (top panels) and CD11b+Ly6CloLy6G− (bottom panels) cells from the mice indicated in (A) was measured by flow cytometry and the mean fluorescence intensity (MFI) is shown. Data are shown as the mean ± SE of two experiments (n = 6). (F) The absolute number of splenic MARCO+ cells (CD11b gated) was determined in the indicated mice in (A). Data are shown as the mean ± SE (n = 3–4). *p<0.05, **p<0.01, ***p<0.001, NS = not significant.

