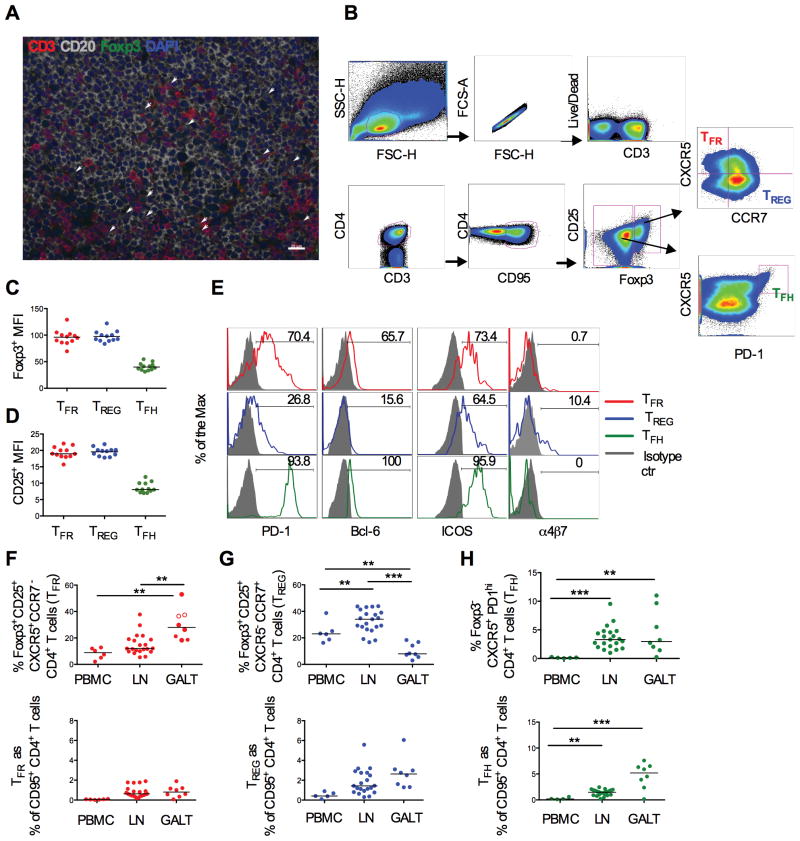
Figure 1. Characterization and distribution of TFR in SIV-uninfected macaques.
(A) Double positive CD3+ (red) and Foxp3+ cells (green) are present in B-follicles (CD20 in grey) in lymph nodes from a naïve macaque (blue =DAPI; scale bar: 20μm). (B) Representative flow cytometry plots showing the gating strategy for TFR, CCR7+-TREG and TFH cells in lymph nodes. All the subsets were gated on singlet/live/CD3+ CD4+ CD95+. TFR and CCR7+-TREG were identified as Foxp3+ CD25+ and CXCR5+ CCR7− or CXCR5− CCR7+, respectively; TFH cells as Foxp3− CXCR5+ PD-1high. (C) Geometric mean (MFI) of Foxp3 and (D) CD25 expression. (E) Cell surface expression of PD-1, Bcl-6 ICOS and α4β7 in TFR (red), TREG (blue) and TFH cells (green). Isotype controls are in grey. Frequency of (F) CXCR5+ & CCR7− cells and (G) CXCR5− & CCR7+ cells within Foxp3+ CD25+ CD4+ T (upper panel) or within memory CD4+ T cells (corresponding lower panels) in blood, peripheral lymph nodes and in the GALT (colon, jejunum and rectal mucosa) of naïve animals. The median is shown. (H) TFH frequency on Foxp3 negative (upper panel) and memory CD4+ T cells (lower panel) in different tissues.

