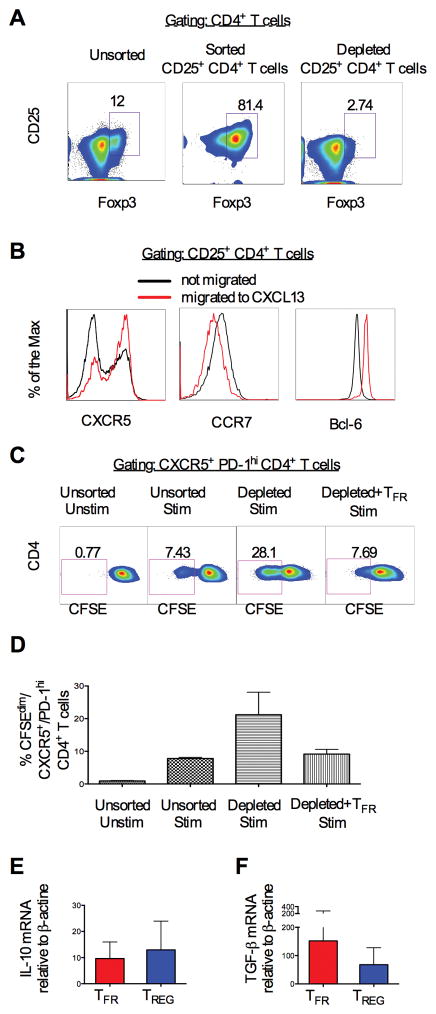
Figure 2. TFR suppress in vitro TFH cell proliferation.
(A) Representative density plot showing unsorted (upper panel), sorted CD25+ CD4+ T cells (central panel) and CD25+ CD4+ T-depleted cells (lower panel) from a lymph node of a naïve macaque. (B) Cell surface expression of CXCR5, CCR7 and Bcl-6 on CD4+ T cells that migrated (red line) or did not migrate (black line) to CXCL13. (C) Representative density plot showing proliferation (CFSEdim) of stimulated (CD3, CD28) unsorted, CD25+ depleted CD4+ T cells alone or co-cultured with CXCL13 migrated-CD25+ CD4+ T cells. (D) Percentage of proliferating CXCR5+ PD1high CD4+ T cells in all conditions. The bars represent the mean ± standard error from 3 lymph nodes. (E) IL-10 and (F) TGF-β mRNA measured by RT-PCR from TFR and CCR7+-TREG sorted from lymph nodes of 4 naïve animals. The bars represent the mean ± standard error.

