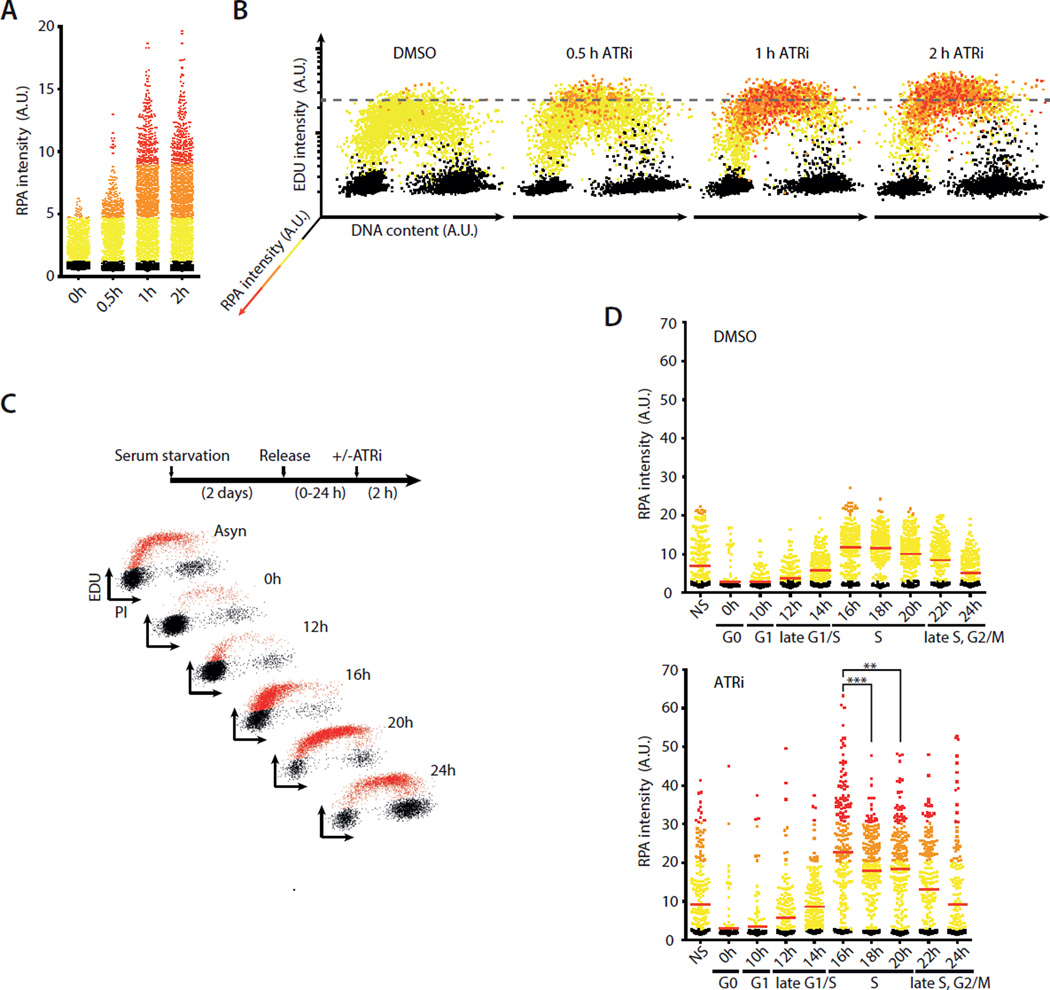
Fig. 2. ATR suppresses ssDNA accumulation in early S phase.
A-B. Quantification of chromatin-bound RPA, EdU incorporation, and DNA contents of 5,000 U2OS cells treated with DMSO or ATRi (10 μM VE-821). Cells were color-coded according to the intensity of RPA staining as shown in the left panel. C. T98G cells were synchronously released from G0 and analyzed for EdU incorporation at the indicated times. D. Staining intensity of chromatin-bound RPA was analyzed at different stages of the cell cycle after ATRi or DMSO treatment. Red lines indicate mean RPA intensities in various cell populations. **, P<0.01; ***, P<0.001. See also Fig. S2.

