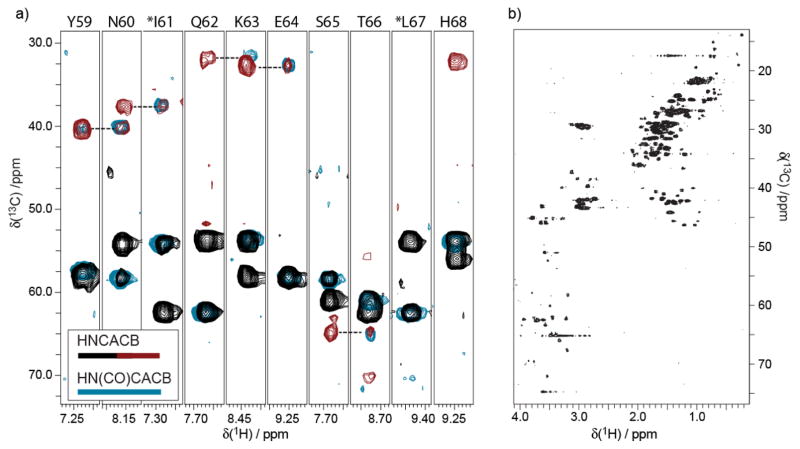
Figure 6.
(a) The use of opt-BDF samples for HNCACB/HN(CO)CACB experiments tests the presence of 13C-13C spin labels. The HN(CO)CACB (light blue contour lines) is superimposed with the HNCACB (black/red contour lines) experiment in order to verify a typical backbone walk pattern. The HNCACB data were acquired on a 0.8 mM sample produced with the opt-10%-BDF method, while the HN(CO)CACB employed a 1.5 mM sample produced following opt-20%w/w-BDF. The 3D-HNCACB (4 scans per increment nonuniformly spanning a 48[13C] x 24[15N] matrix, sw13C=80 ppm, sw15N=35 ppm, 2.0 second recycle time, 150 ms acquisition) was acquired in just 10 hrs, while the HN(CO)CACB was acquired in 19.6 hrs (4 scans per increment for a 64[13C] x 32[15N] matrix, sw13C=80 ppm, sw15N=35ppm, 2.0 second recycle time, 150 ms acquisition), both processed via FFT, including linear prediction in the 15N dimension. (b) The inclusion of 13C throughout the expressed protein is illustrated by a representative 13C-HSQC (512 increment, 8 scans per increment, 1.5 s recycle time) of the same sample used for the HNCACB in panel (a).

