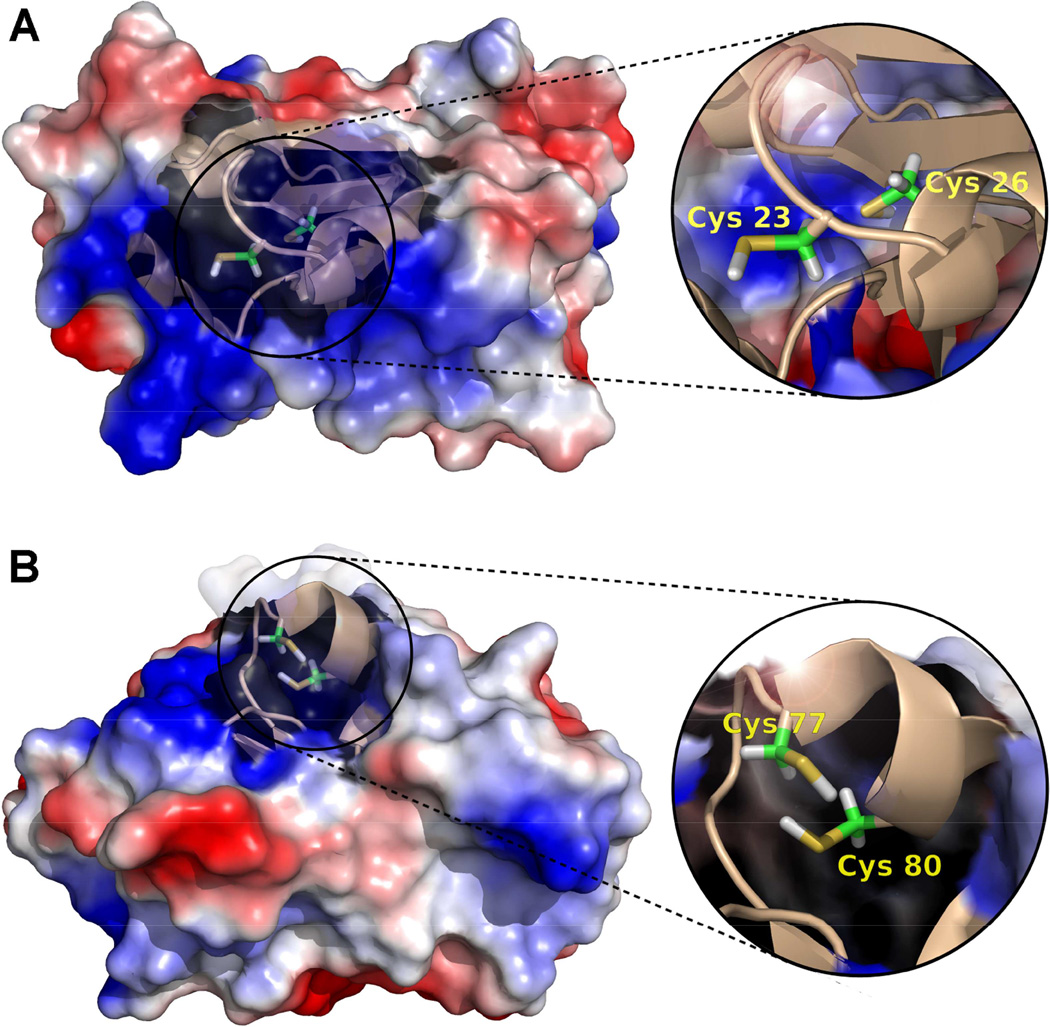
Figure 7.
Electrostatic potential surface and cartoon representations of A) hGrx-1 (adapted from pdb: 1JHB, model 8), and B) hGrx-2 (adapted from pdb: 2FLS). The close ups show the structural details of the catalytic cys residues (23, 26 and 77, 80 for Grx-1 and Grx-2, respectively). Images were generated using the PyMol Molecular Graphics System, Version 1.2r1, Schrödinger, LLC.

