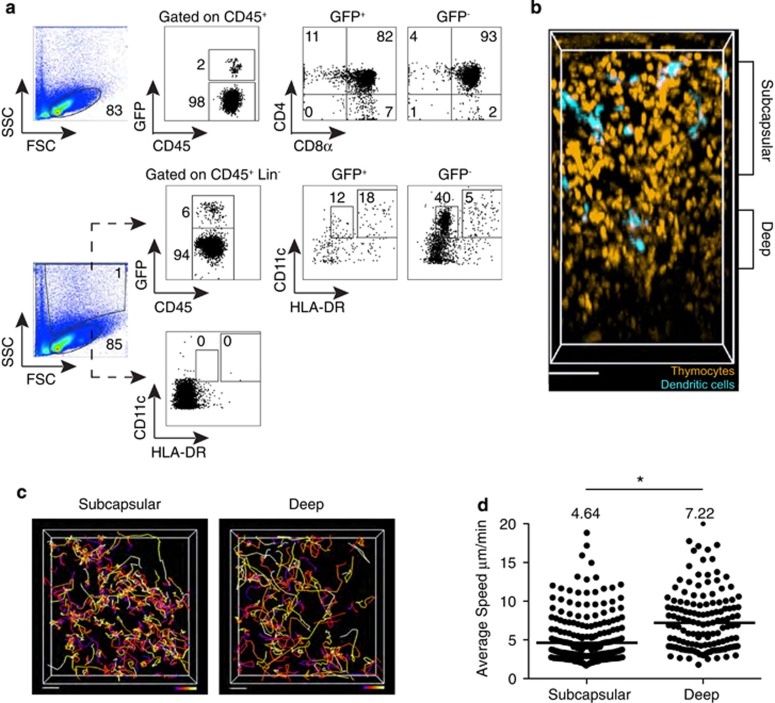
Figure 3.
2-photon imaging of the thymus of humanized mice reconstituted with GFP-expressing human CD34+ hematopoietic progenitors. NSG and NSG HLA-A2 tg mice were reconstituted with GFP-transduced HLA-A2− cord blood progenitors, and all data from NSG and NSG HLA-A2 tg thymi were combined for image analysis. (a) Flow-cytometric analysis of the thymus of a NSG humanized mouse 12 weeks post reconstitution depicting the gating strategy for identification of thymocyte developmental intermediates among human CD45+ cells (top panels), and HLA-DRint CD11c+ and HLA-DRhigh CD11c+ DC subsets among CD45+ Lin− (CD3− CD19−CD56−) cells (bottom panels) within the GFP+ and GFP− fractions of the collagenase digested thymus. (b) 2-photon imaging volume of GFP labeled human thymocytes and DCs within the thymus of an NSG humanized mouse at 12 weeks post reconstitution. For ease of visualization, thymocytes are artificially colored orange and DCs are colored turquoise. Depicted is the compartmentalization of the imaging volume based on distance from the capsule. Scale bar, 70 μm. Thymus was processed for flow cytometry after imaging and data from the same thymus sample are shown in (a). (c) Cell tracks from representative 2-photon time-lapse data sets of human thymocytes within the subcapsular (90 μm in depth, starting 30 μm below the capsule) and deep (30 μm in depth, starting 165 μm below the capsule) portions of the thymus of a humanized mouse (~27 min movies). Tracks are color-coded to represent the passage of time (blue>red>yellow>white). Scale bar 20 μm. (d) Average speed of human thymocytes in the thymus of humanized mice. Each dot represents average speed of an individual tracked cell, and the line represents the average value of compiled track averages for each location. Data represent analysis of two individual imaging volumes obtained from two individual mice. n=300 tracks (subcapsular cells); n=149 tracks (deep cells). * indicates P<0.05.

