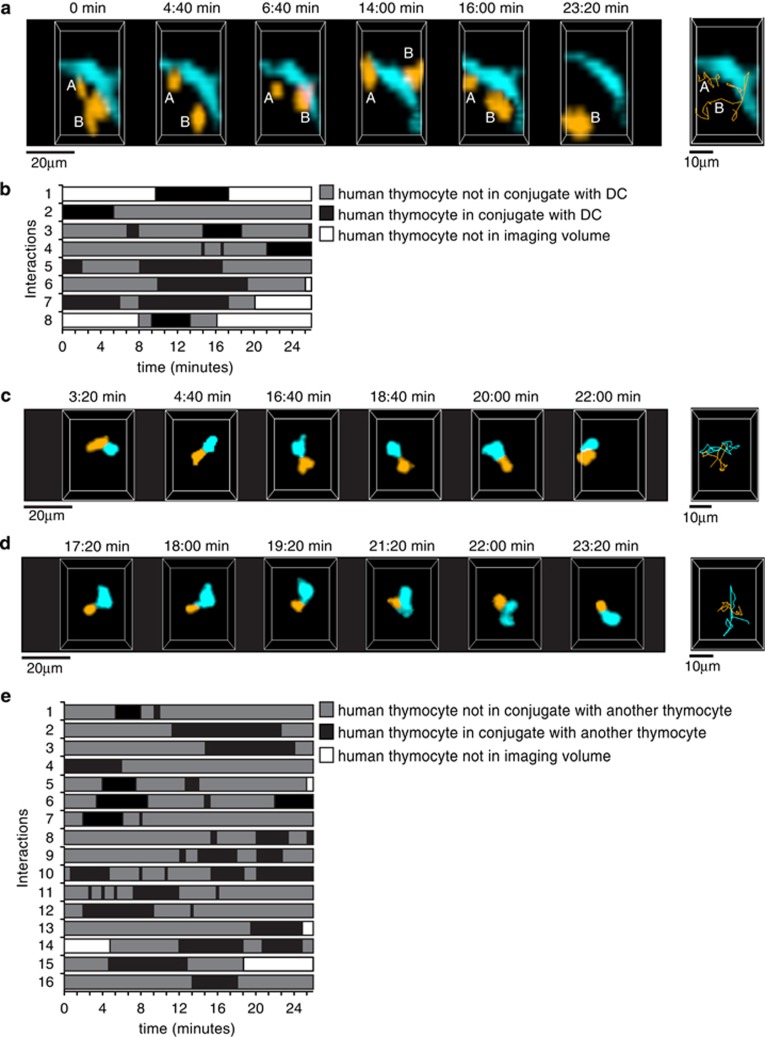
Figure 4.
Contacts between human thymocytes and DCs in the thymus of humanized mice. NSG and NSG HLA-A2 tg mice were reconstituted with GFP-transduced HLA-A2− cord blood progenitors, and all data from NSG and NSG HLA-A2 tg thymi were combined for image analysis. (a) Cropped representation of 2-photon imaging volumes at indicated time points of human thymocytes contacting a human DC within the thymus of a humanized mouse. Thymocytes and DCs were distinguished based on size and morphology. The thymocytes are color-coded in orange, 'A' and 'B' identify two individual thymocytes. The DC is color-coded in turquoise. Far right panel, thymocyte tracks (orange) for the duration of the movie. Representative of a total of 8 interactions involving 8 different labeled thymocytes/150 thymocytes tracked with an approximate density of 8 DCs/imaging volume. (b) Timeline chart depicting the time of contact with DCs of 8 tracked thymocytes for a total of 40 time points (~27 min). Black boxes indicate periods of thymocyte:DC contacts. (c, d) Cropped representations of 2-photon imaging volumes at indicated time points of human thymocyte:thymocyte contacts within the thymus of a humanized mouse. Thymocytes are color-coded in orange and turquoise for improved visualization. Far right panels, thymocyte tracks for the duration of the movie. (e) Timeline chart depicting the time of contact with other thymocytes of 16 tracked thymocytes for a total of 40 time points (~27 min). For ease of representation, only thymocytes in contact with one other thymocyte are depicted. Black boxes indicate periods of contact between thymocytes.

