Fig. 2.
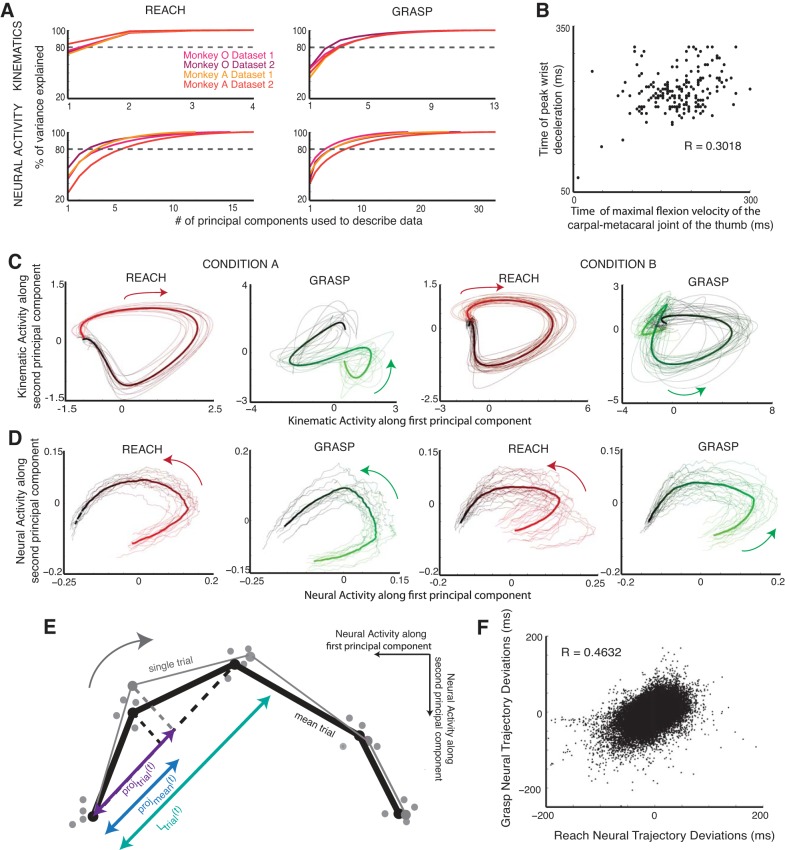
Trajectory analysis. A: % of variance explained by reach-related and grasp-related neural and kinematic data for monkey O and monkey A as a function of the number of principal components. B: time of maximal flexion velocity of the carpal-metacarpal joint of the thumb, a proxy for maximum aperture, plotted against time of peak wrist deceleration for all of the trials in 1 data set where monkey O was reaching to grasp the vertical D-ring. C: kinematic trajectories of proximal (reach related) and distal (grasp related) joints in a reduced-dimensional space. Trials shown are for condition A, where 1 monkey reached to grasp a sphere at 1 location, and condition B, where the same monkey reached to the vertical D-ring at a different location. Mean trajectories for the condition are shown as thick lines. D: neural population trajectories of reach-related and grasp-related activity in reduced-dimensional space for the same 2 conditions. Mean trajectories for the condition are shown as thick lines. Color gradients in C and D reflect time from the beginning (red/green) to end (black) of the trial. E: cartoon illustration of a single-trial reach-related trajectory and mean trajectory projected onto a local approximation of the mean trajectory (black dashed line) in 2-dimensional principal component space. The projections are in purple and blue, respectively. (Samples from other trials are also shown as gray dots.) The ratio of the difference between the two projections (i.e., the single trial onto the local approximation to the mean minus the mean onto the local approximation to the mean) and the length of the approximation of the mean trajectory (turquoise) is used to convert the deviations into units of time. F: deviations for reach and grasp neural trajectories plotted against each other for all of the trials in 1 data set (monkey O).

