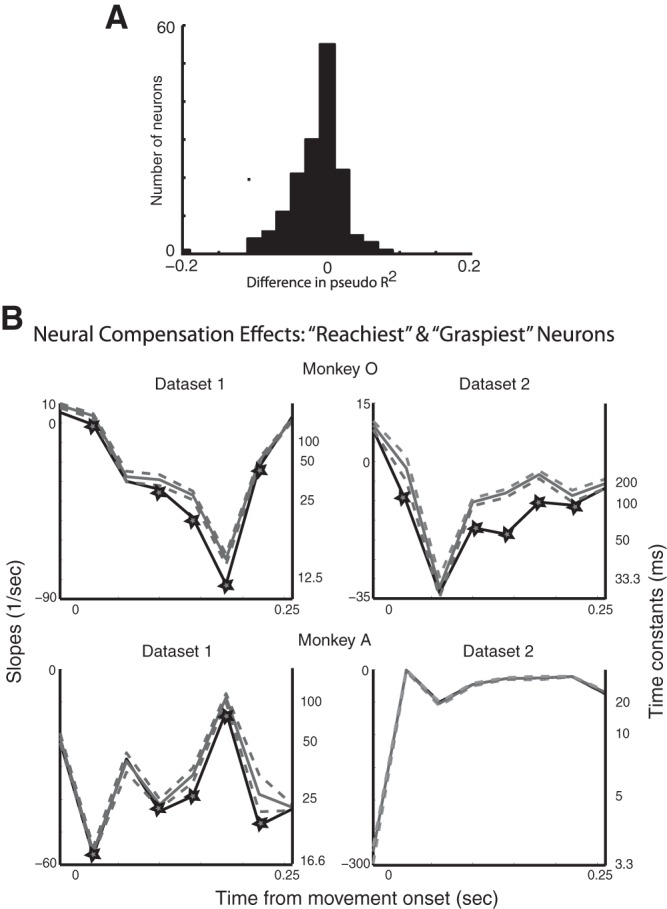
Fig. 4.

A: histogram of differences between the pseudo-R2 values for the models based on reach-related and grasp-related kinematics for all of the data sets. B: the subpopulations were comprised of 10 “reachiest” and 10 “graspiest” neurons. Slopes of compensation (black) and mean shuffled slopes of compensation (gray, with 5% and 95% confidence levels after Bonferroni correction) are plotted throughout the course of movement. Intervals with significant compensation effects are starred; time constants are shown in black.
