
Fig. 5.
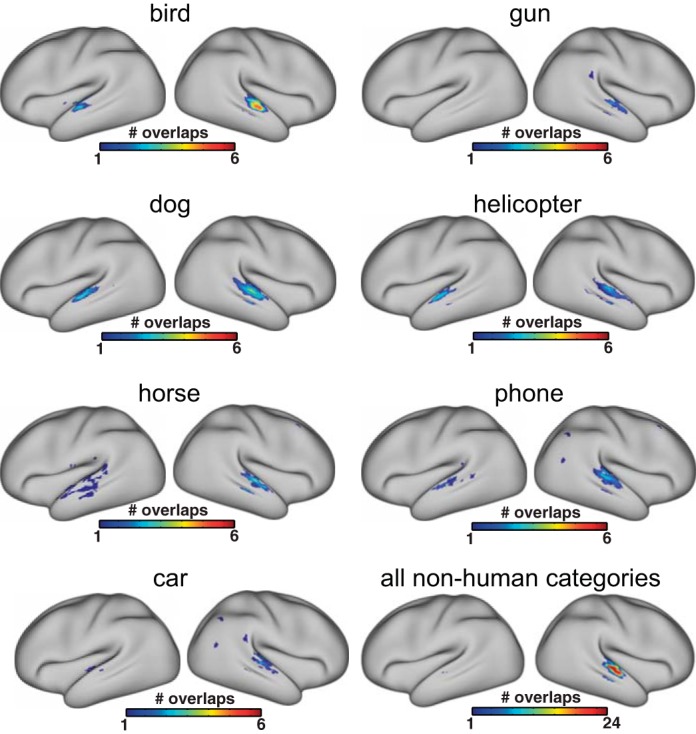
Overlaps of binary classification for target vs. nontarget, performed on each of the 7 nonhuman categories. For binary classifications on nonhuman categories, human was excluded from the analysis. The color bar indicates the number of overlaps amongst the binary classification map, in which red depicts voxels that emerged across all comparisons.