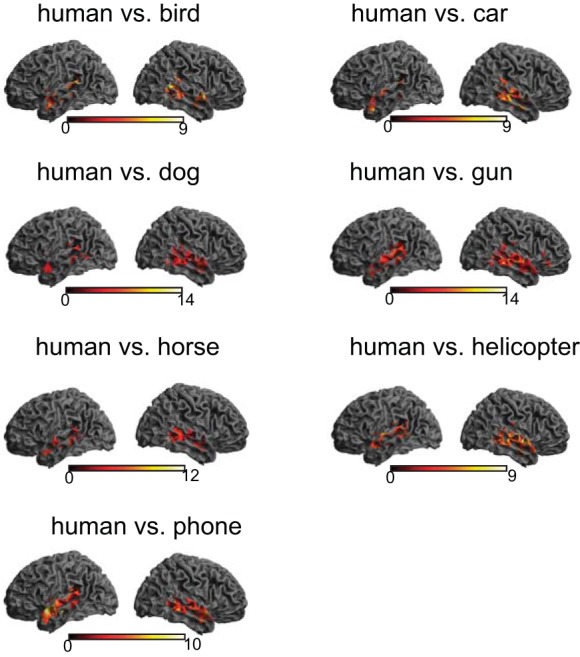
Fig. 6.

Cortical rendering views of positive predictive value (PPV) comparisons out of an 8-way classification test. After a PPV map for each category is obtained from the 8-way classification, the sensitivity index of human is compared with that of each of the nonhuman categories at the group level. All comparisons consistently yield greater voice sensitivity in bilateral temporal lobes. The color bar indicates t-statistics.
