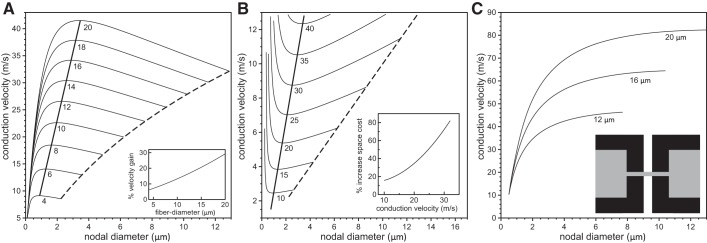
Fig. 6.

Analysis of velocity gain and space cost for a steplike taper. In A, the conduction velocity is plotted against the nodal diameters for values of fiber diameter ranging from 4 μm to 20 μm (indicated below each line) and 5 × 10³ nodal sodium channels. The dashed lines in A indicate velocities for an unconstricted fiber, i.e., an axon with identical nodal and internodal diameters. The thick solid line indicates the velocities of fibers optimized for maximum conduction velocities. The inset in A indicates the percent gain in conduction velocity for a range of fiber diameters compared with a fiber with an unconstricted axon. In B, we show contour lines of constant conduction velocity on the Cartesian plane of nodal diameter vs. internodal diameter for conduction velocities ranging from 10 m/s to 40 m/s (indicated below each line) and 5 × 10³ nodal sodium channels. The nodal and internodal axon diameters are identical on the dashed line. The thick solid line indicates fiber morphologies with the minimal internodal axon diameter for the given target conduction velocities. The inset indicates the percentage increase in volume (i.e., spatial cost) for an unconstricted axon (internodal diameter = nodal diameter) compared with an axon with optimal nodal constrictions. In C, we show the conduction velocity as a function of the nodal diameter for three values of the fiber diameter when the sodium channel density is constant, i.e., when the numbers of nodal sodium channels increase linearly with the nodal diameter. The inset displays the steplike tapering of the axon and myelin in the PARA region.
