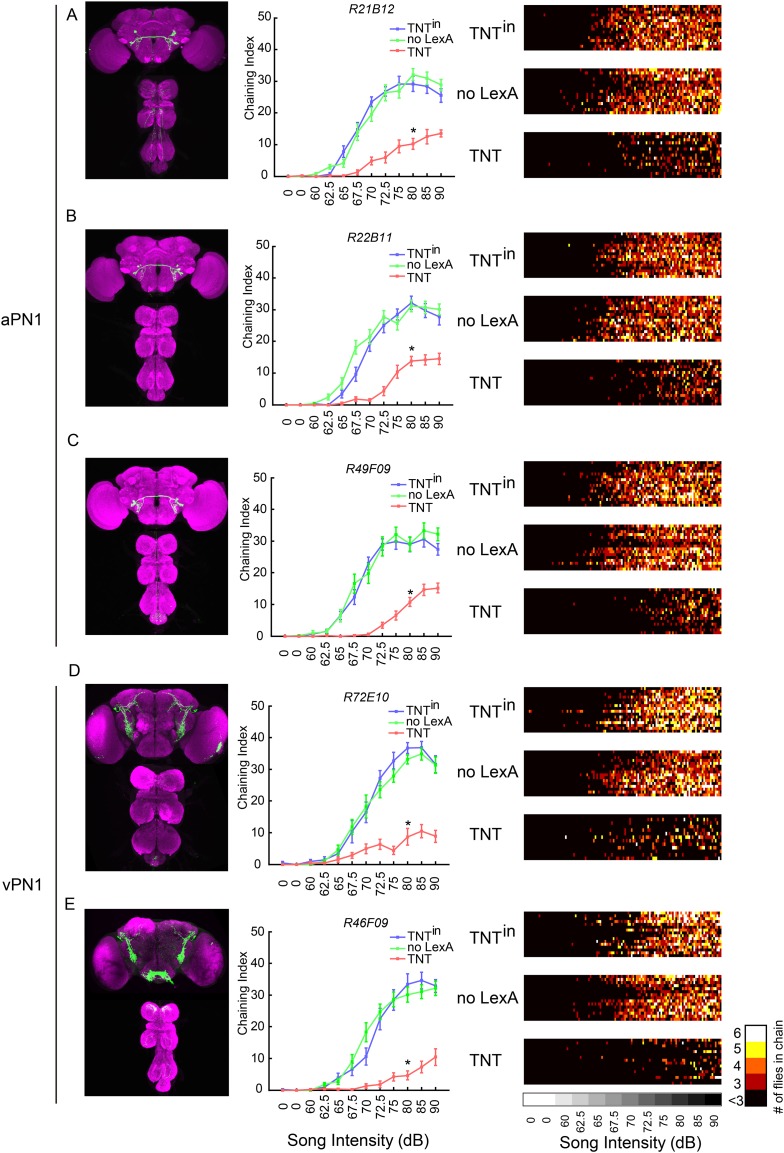
Figure 4. Inactivation of second- and third-order auditory neurons reduced chaining responses to pulse song.
(A–C) Silencing aPN1 neurons decreased song-induced chaining responses. aPN1 drivers R21B12-GAL4 (A), R22B11-GAL4 (B), or R49F09-GAL4 (C) were crossed to UAS>stop>TNT; fruLexA, LexAop2-FLP (TNT group), UAS>stop>TNTin; fruLexA, LexAop2-FLP (TNTin group), or UAS>stop>TNT; LexAop2-FLP (no LexA group). (D, E) Silencing vPN1 neurons decreased song-induced chaining responses. vPN1 drivers R72E10-GAL4 (D), R46F09-GAL4 (E) were crossed to UAS>stop>TNT; fruLexA, LexAop2-FLP (TNT group), UAS>stop>TNTin; fruLexA, LexAop2-FLP (TNTin group), or UAS>stop>TNT; LexAop2-FLP (no LexA group). n = 13–16 for each condition. *p < 0.0001 compared to both controls at 80 dB, Wilcoxon rank-sum test. Shown in the left panel is GFP expression of each intersectional driver. In the right panel, a heat map summary shows chaining intensities across the testing time course. Each row corresponds to a group of six flies. Colors represent the number of flies in chain.

