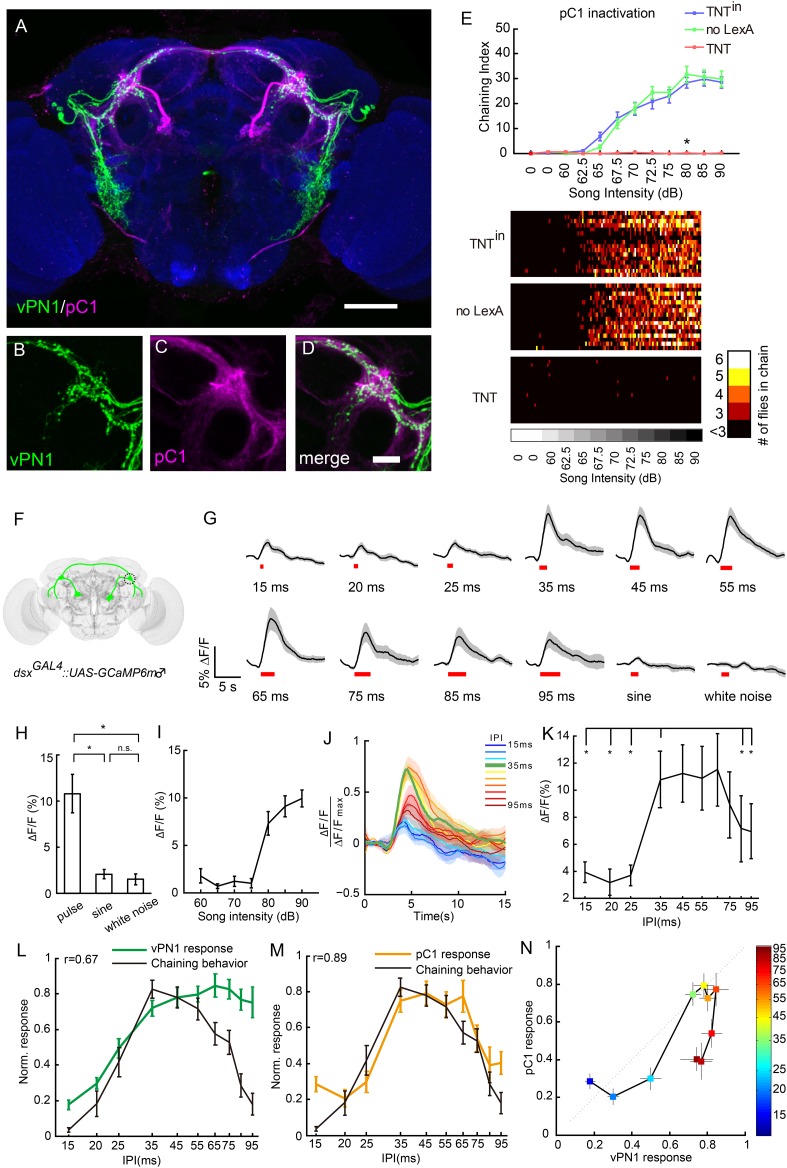
Figure 6. Anatomical, behavioral, and physiological characterization of dsx+ pC1 neurons in auditory sensation.
(A–D) Co-registration of vPN1(green) and pC1(magenta) neurons onto the standard brain. Genotype for labeling vPN1 neurons: LexAop2-FLP/+; fruLexA, UAS>stop>myr::GFP/R72E10-GAL4. Genotype for labeling vPN1 neurons: R71G01-LexA/UAS>stop>myr::GFP; dsxGAL4, LexAop2-FLP/+. vPN1 processes (B) and pC1 (C) processes overlap in the region of lateral protocerebral complex (LPC). (D) Merge of (B) and (C). Scale bars, (A) 100 μm and (D) 20 μm. (E) Song-induced chaining response was impaired by inactivation of pC1 neurons. Genotypes: UAS>stop>TNTin/71G01-LexA; dsxGAL4, LexAop2-FLP/+ (TNTin), UAS>stop>TNT/+; dsxGAL4, LexAop2-FLP/+ (no LexA), UAS>stop>TNT/71G01-LexA; dsxGAL4, LexAop2-FLP/+ (TNT). n = 16 for all the conditions. *p < 0.0001 when comparing TNT group to both controls at 80 dB, Wilcoxon rank-sum test. Bottom, heat map analysis of chaining events for individual groups of flies. (F) Diagram of pC1 neurons labeled with dsxGAL4 driving expression of GCaMP6. Neurites innervating the LPC are circled. (G) Calcium responses of pC1 neurons responding to different IPIs, sine song, and white noise at 80 dB. Pulse song stimuli consist of a train of 40 pulses. Black lines indicate mean values, while gray areas indicate SEM. Song stimulus durations are indicated as red bars. (H) Peak ∆F/F values of pC1 neurons stimulated with pulse song (35-ms IPI, 40 pulses), sine song (140 Hz, 1.4 s), and white noise (1.4 s) at 80 dB. *p < 0.01, Wilcoxon rank-sum test. No significance was observed for sine vs white noise. n = 12 for all the groups. (I) Peak ∆F/F values of pC1 neurons stimulated with pulse song (35-ms IPI, 40 pulses) from 60 dB to 90 dB. pC1 neurons are only sensitive to pulse song stimuli above 80 dB. n = 9 trials for each sound level. (J) Normalized calcium traces of pC1 neurons at different IPIs. Each ∆F/F was normalized by the maximum ∆F/F. (K) Peak ∆F/F of pC1 neurons stimulated with different IPIs at 80 dB (40 pulses). n = 12 for all groups. *p < 0.01, Wilcoxon signed-rank test. (L) Comparison between the calcium response (peak ∆F/F) of vPN1 neurons and chaining responses to different IPIs shown in Figure 3E (R = 0.67; p < 0.017, permutation test). Both calcium responses and chaining responses are normalized to their respective maximum responses. (M) Comparison between the calcium response (peak ∆F/F) of pC1 neurons and chaining responses to different IPIs shown in Figure 3E (R = 0.89; p < 0.001, permutation test). Both calcium responses and chaining responses are normalized to their respective maximum responses. (N) Comparison between normalized vPN1 responses and pC1 responses. Each colored square represents a different IPI indicated by the heat map. Error bars represent SEM in all panels.


