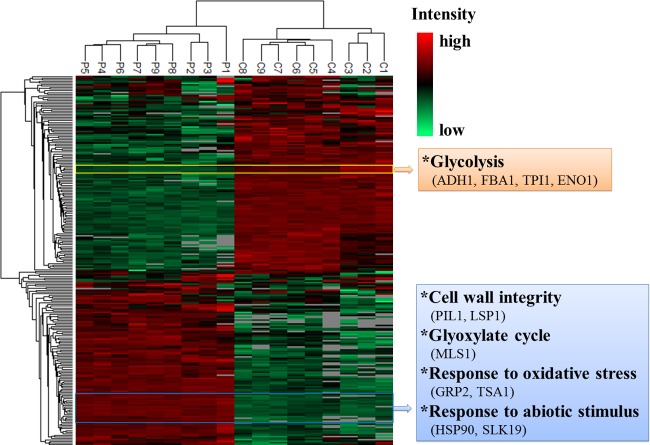
FIG 6.
Two-way hierarchical clustering (P, persisters; C, controls). The hierarchical clustering analysis groups the samples of persisters and controls separately, and it shows distinct profiles of protein expression between the two clusters. Proteins that reveal the same changing patterns are clustered in the column tree on the left. The proteins listed in the rectangles on the right display similar expression patterns.

