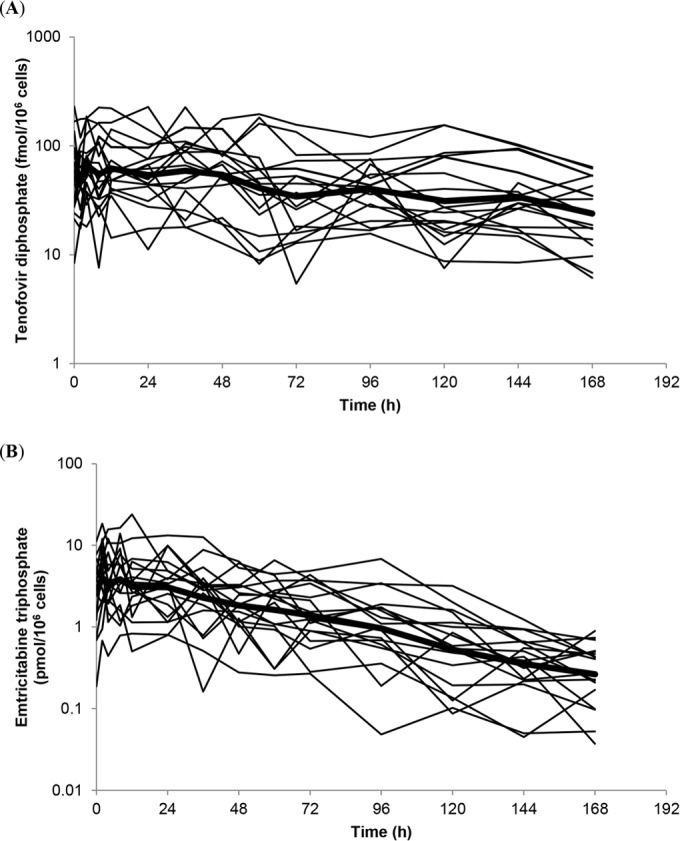
FIG 2.

Individual predicted intracellular tenofovir diphosphate (A) and emtricitabine triphosphate (B) concentrations over 168 h following drug intake cessation in healthy volunteers on a log-linear scale (n = 18; individual concentration-time profiles generated by modeling and simulation). The bold line represents the geometric mean concentration-time profile.
