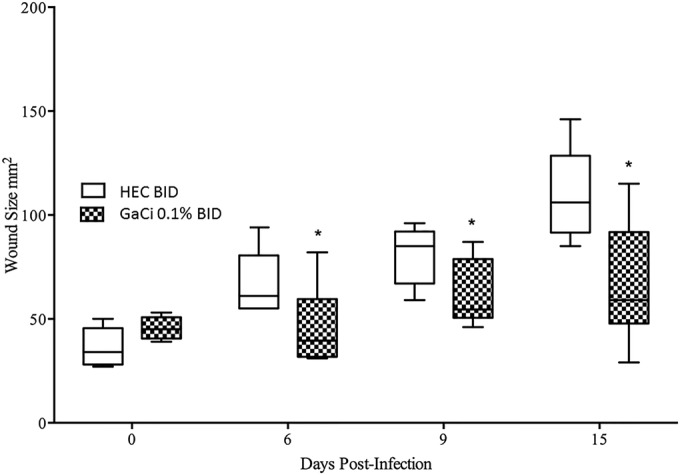
FIG 3.

Wound area over time (0.1% GaCi versus HEC alone control). Box and whisker plots show wound sizes on days 0, 6, 9, and 15 postinfection where each wound was treated with HEC alone BID (negative control) or HEC with 0.1% GaCi BID for 3 days. Boxes show median and interquartile ranges, while whiskers represent 95% confidence intervals (CI). Treatment groups were compared each day via Mann-Whitney U test. *, P value of <0.05. These data are pooled from three separate experiments with 12 mice per group and 48 mice per test condition.
