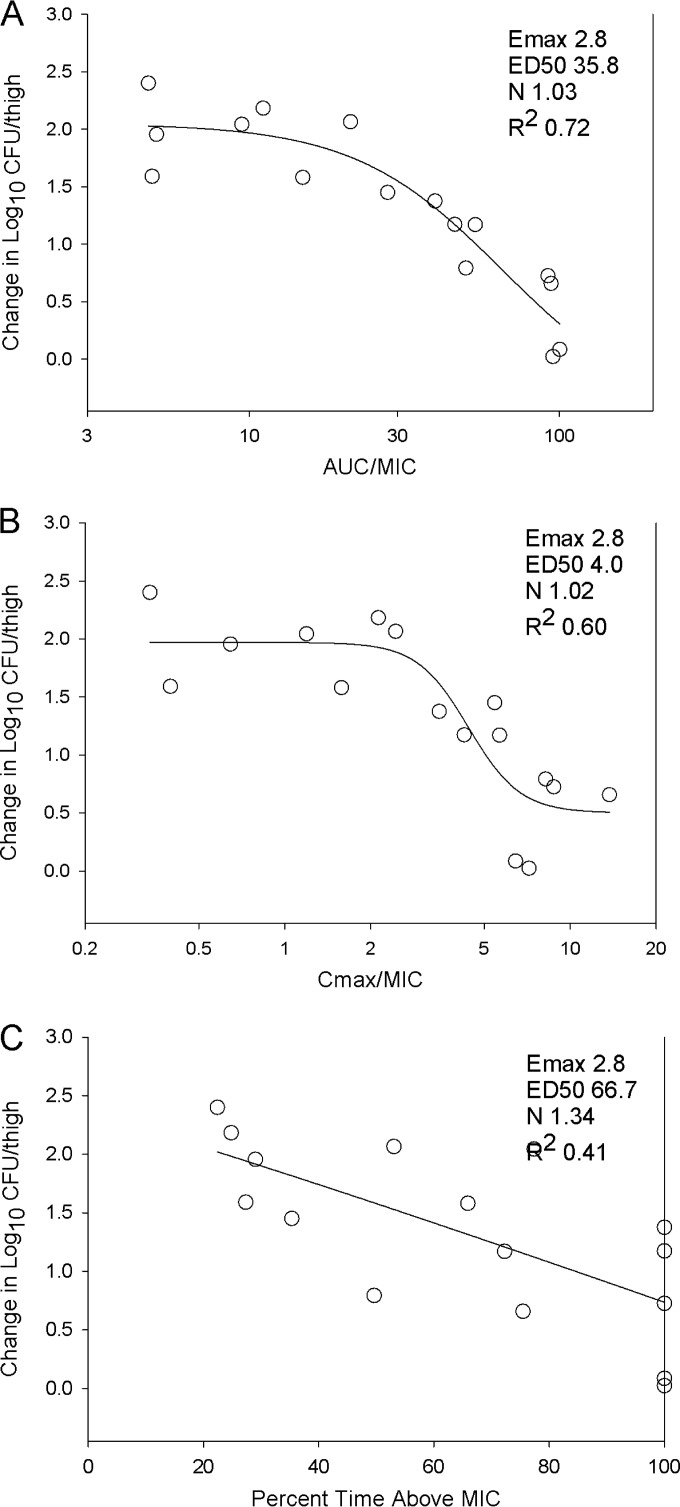
FIG 3.
Impact of pharmacodynamic regression in the in vivo dose fractionation study with TXA-709 against S. aureus ATCC 25923. Each symbol represents the mean of data from four thighs. The dose data are expressed as AUC/MIC (A), Cmax/MIC (B), and the percentage of time during which serum concentrations exceeded the MIC (C). The R2 data represent the coefficient of determination. The maximal effect (Emax), the PD index value associated with 50% of the maximal effect (ED50), and the slope of the relationship or the Hill coefficient (N) are also shown for each PD index. The line drawn through the data points is the best-fit line based on the sigmoid Emax formula.

