
FIG 2.
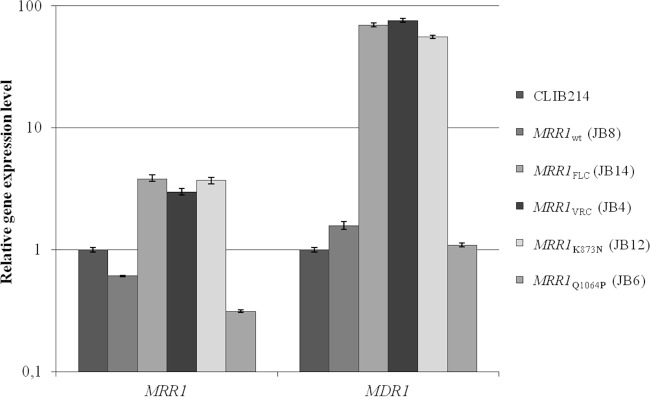
Mutations G583R and K873N induce overexpression of MRR1 and MDR1 genes. Quantitative real-time PCR (qRT-PCR) analysis of the MRR1 and MDR1 gene expression in the JB8, JB14, JB4, JB12, and JB6 strains, using the CLIB214 strain as a control. Due to the large range in gene expression levels, the y axis scale is logarithmic. The expression values displayed in the graph represent the variation of MRR1 and MDR1 gene expression relative to the CLIB214 strain and are expressed as the mean of five independent experiments, with the respective standard deviation. Amplification efficiency and the amount of TUB4 (endogenous reference gene) were used to normalize each mean value.