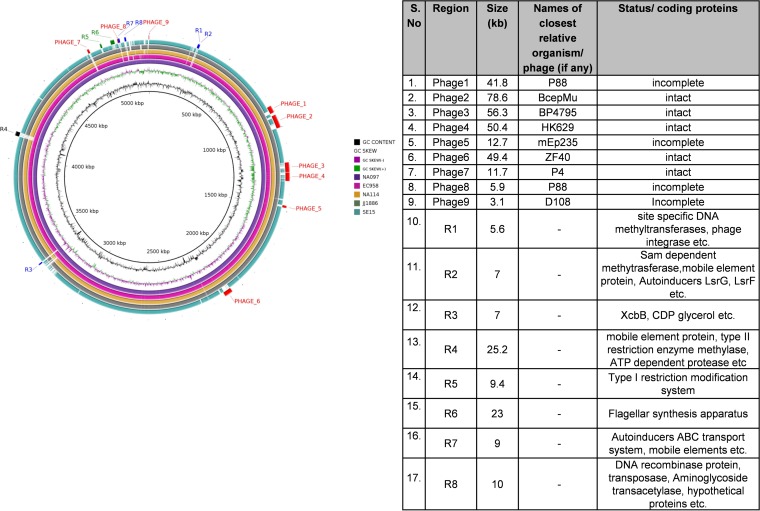
FIG 1.
Left, BRIG figure, representing a comparison of NA097 with four reference genomes of ST131 E. coli downloaded from the NCBI. Blue regions (R1, R2, R3, R7, and R8) are present only in NA097, the black region (R4) is present only in NA097 and EC958, green regions (R5 and R6) are absent in SE15, and red regions are phage-associated regions. Right, details of the regions and their relevant sizes.

