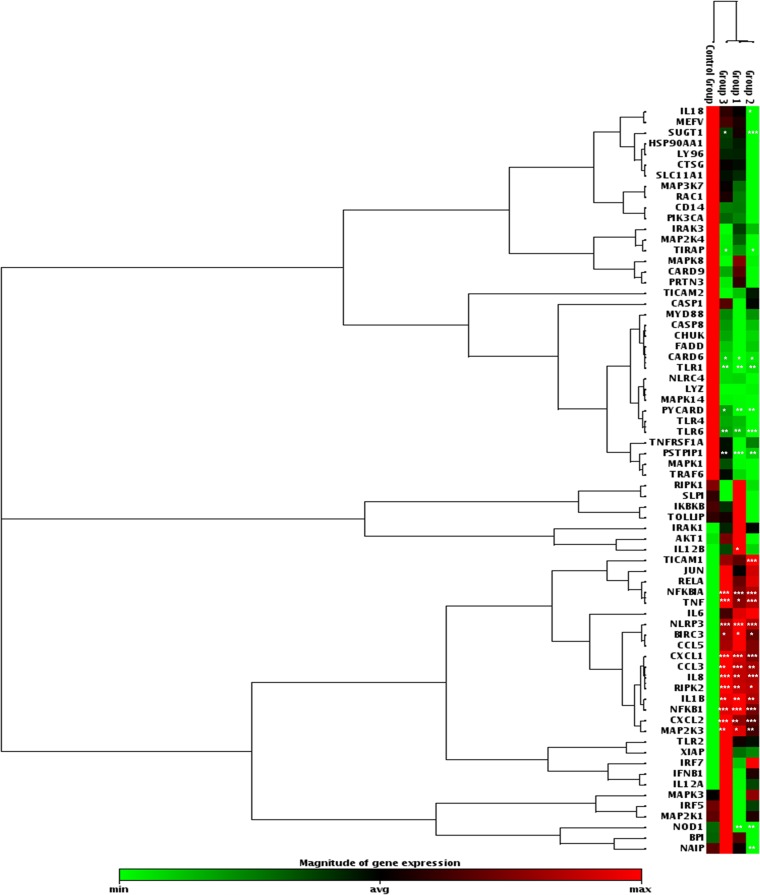
FIG 4.
Cluster diagram indicating transcript levels of genes associated with bacterial infections in THP-1 cells. Group 1, LPS-treated cell sample; group 2, cells infected with E. coli strain DH5α; group 3, cells infected with strain NA097. Untreated THP-1 cells were used as the control. Online RT2 Profiler array data analysis custom software (version 3.5) from Qiagen was used to obtain statistical values (Student's t test), according to the RT2 Profiler instructions. *, P < 0.05; **, P < 0.01; ***, P < 0.001.

