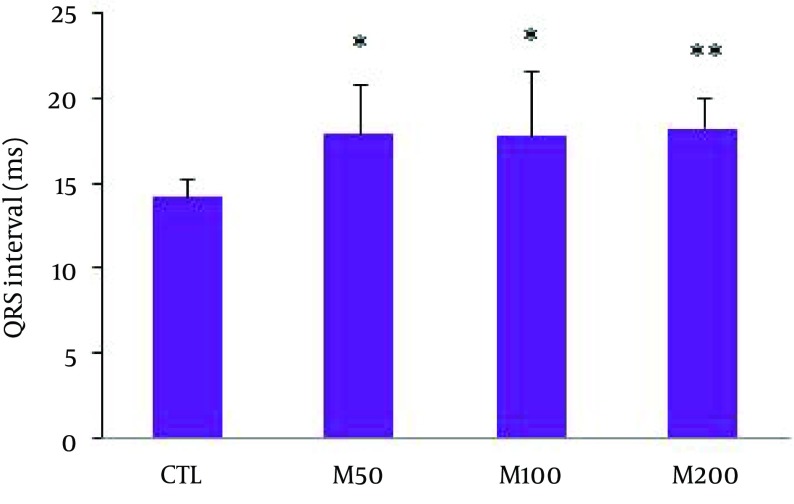
Figure 2. QRS Interval in All Groups.
Values are expressed in Mean ± SD, CTL: the control group, M50: animal group which received 50 mg/kg/day of M. officinalis extract, M100: animal group which received 100 mg/kg/day of M. officinalis extract, M200: animal group which received 200 mg/kg/day of M. officinalis extract. n = 8, * P < 0.05 and ** P < 0.01 vs. CTL group.

