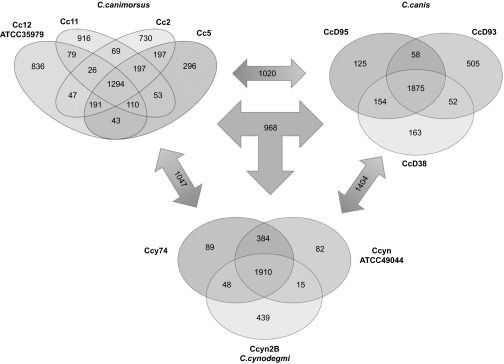
Figure 3.

Core/Pan genome comparison between C. canimorsus, C. canis, and C. cynodegmi sequenced strains. Genome comparison was performed using the MicroScope Comparative Genomics Pan/core genome tool. Numbers correspond to gene families shared by the different genomes. Numbers in double arrows indicate families shared by two species while numbers in the triple arrow correspond to gene families found in all three groups.
