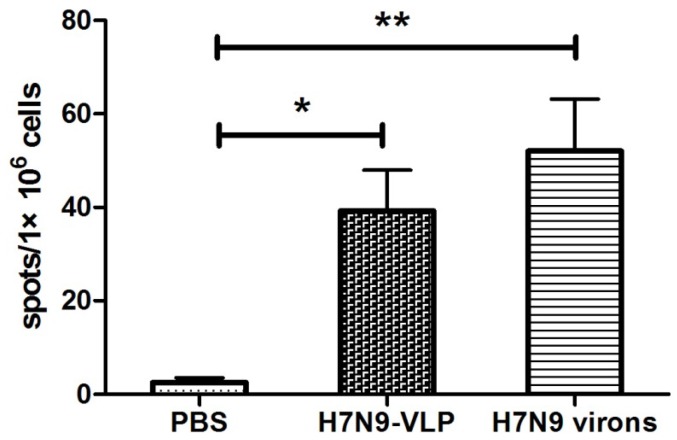
Figure 4.
H7N9 specific T cell responses evaluated by IFN-γ ELISPOT assay. Mice were immunized with H7N9 VLPs, virions or PBS (n = 8 mice/group) for three times at two-week intervals. Spleen cells were collected from individual mouse and stimulated in vitro with H7N9 virions. ELISPOT assay was performed to test IFN-γ PRODUCTION. The mean number of spot forming cells/106 splenocytes was shown with a S.D. bar. * indicates p < 0.05; ** indicates p < 0.01.

