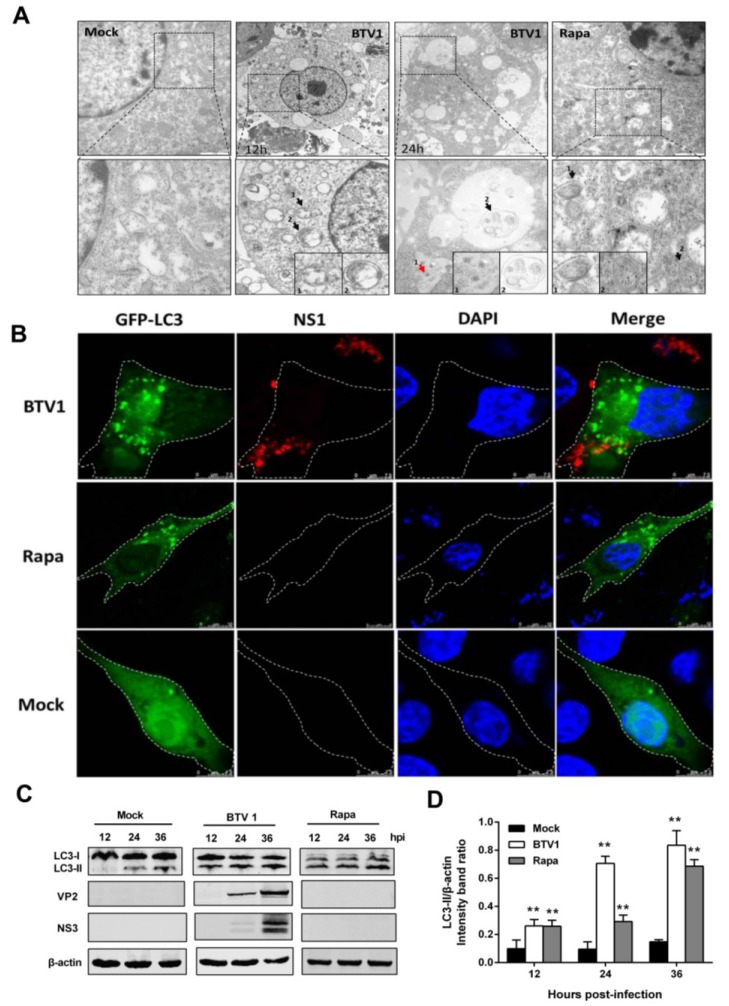
Figure 1.
BTV1 infection triggers cellular autophagy in BSR cells. (A) TEM analysis. Mock-treated BSR cells as a negative control showed normal distribution of organelles. BSR cells infected with BTV1 at an MOI of 1 were harvested at 12 or 24 hpi and subjected to TEM observation. Cup-shaped membranous structures or autophagosome-like structures in the cytoplasm are indicated by the black arrows and BTV particles were pointed by red arrow. Higher-magnification views were listed below. Scale bars: 500 nm. Rapamycin-treated BSR cells were set as a positive control; (B) Confocal microscopy. Aggregation of autophagosomes is shown as green puncta in BSR cells that were transfected with GFP-LC3 followed by treatment with rapamycin (positive control); or infection of BTV1 at an MOI of 1 for 24 h at 24 h post-transfection. Mock treatment was a negative control. In addition, NS1 protein of BTV shown in red was used as indicator for BTV infection. The cell nucleuses were stained with DAPI. Scale bar: 7.5 μm. The outlines of the cells on the image were sketched by white dash line; (C) Western blotting. Transformation of LC3-II from LC3-I was detected in mock or BTV-infected BSR cells using an anti-LC3B antibody, and the expression of VP2 and NS3 of BTV1 was also detected using anti-VP2 and anti-NS3 antibodies, respectively. Rapamycin-treated group was positive control; (D) Intensity band ratios of LC3-II/β-actin. The values represent the mean ± SD of three independent experiments. Statistical significance was analyzed with Student’s t-test (* p < 0.05 and ** p < 0.01).

