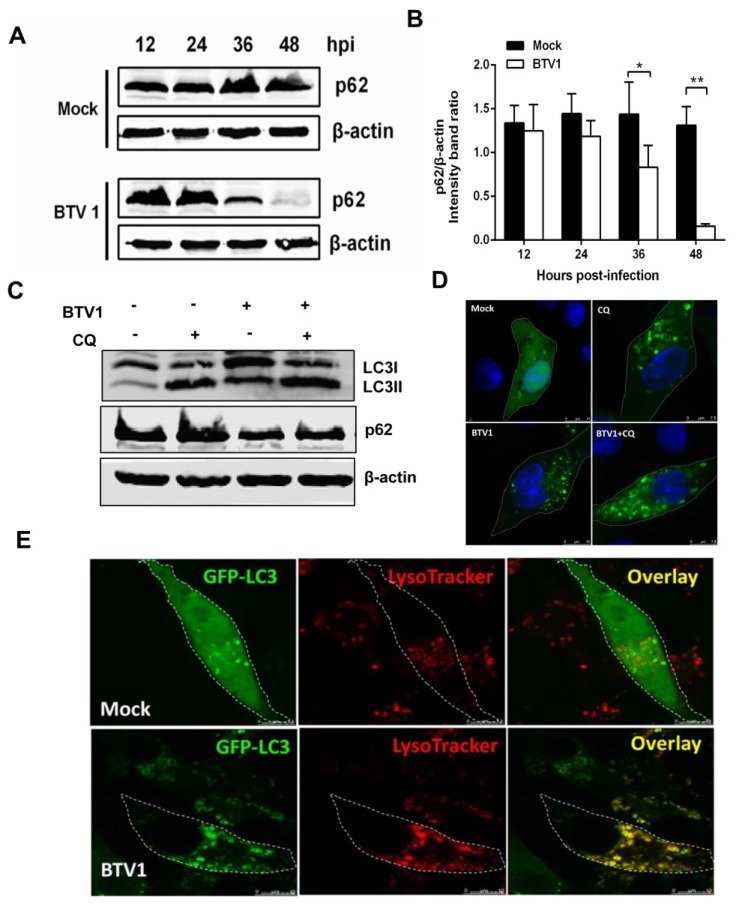
Figure 3.
Autophagic flux measurement in BSR cells infected with BTV1. (A) p62/SQSTM1 (p62) degradation was tested by Western blotting. p62 in BTV1-infected and mock-infected BSR cells was monitored using an anti-p62 antibody; (B) Representative graphs were shown exhibiting the ratios of p62 to β-actin (mean ± SD) from three independent experiments. Statistical significance was analyzed with Student’s t test (* p < 0.05 and ** p < 0.01); (C) The expression levels of LC3-II and p62 were detected by Western blotting after mock-infection or BTV1-infection in the presence or absence of 20 μM CQ for 24 h; (D) Representative confocal images of BTV with or without CQ treatment for 24 h; (E) Representative confocal images of co-localization of the autophagosome marker GFP-LC3 (green) with the acidic lysosome marker LysoTracker (red) in BSR cells infected with BTV1 for 36 h. Mock-infected cells served as negative control. Scale bar: 7.5 μm.

