
Figure 1.
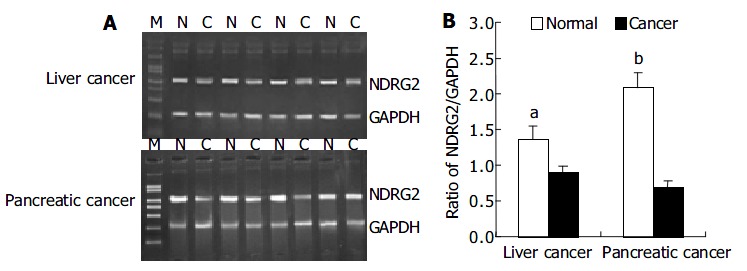
Expressions of NDRG2 mRNA in human liver cancer and pancreatic cancer. A: Representative agarose gels of RT-PCR-amplified NDRG2. M: DNA molecular weight marker; N: Normal tissue; C: Cancer tissue; B: Relative amount of NDRG2 mRNA was evaluated by the ratio of band optical density of NDRG2/GAPDH and the expression was significantly decreased in cancer (n = 29 for liver cancer, and 8 for pancreatic cancer respectively) vs normal tissues. aP<0.05, bP < 0.01 vs normal.