
Figure 4.
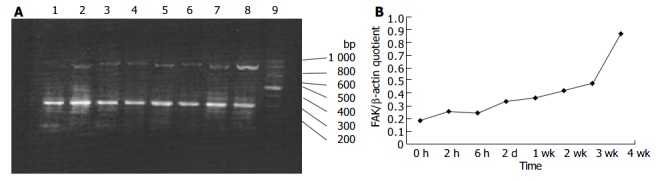
RT-PCR analysis of mRNA encoding FAK in hepatic fibrogenesis A: RT-PCR analysis of mRNA encoding FAK in hepatic fibrogenesis at different time points. Lane 1: sham operation group; lane 2: BDL 2 h; lane 3: BDL 6 h; lane 4: BDL 2 d; lane 5: BDL 1 wk; lane 6: BDL 2 wk; lane 7: BDL 3 wk; lane 8: BDL 4 wk; lane 9: Marker B: Band intensities were quantified by densitometry. FAK/β -actin quotient indicated the relative expression of FAK.