Figure 3.

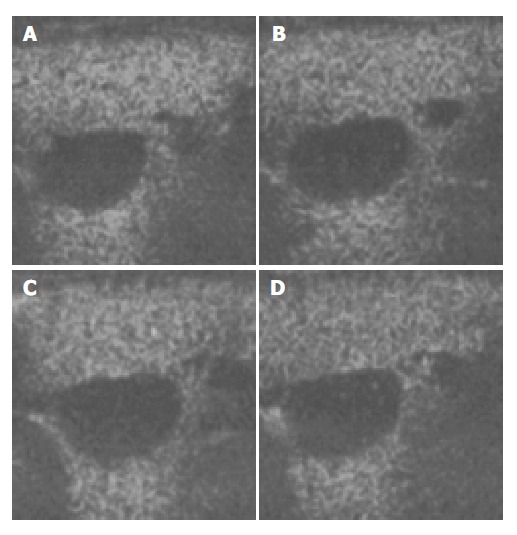
Ultrasound images of liver parenchyma and inferior vena cava (IVC) before and after the injection of microbubbles. A: 15 min after injection; B: 25 min after injection; C: 30 min after the injection; D: 40 min after the injection.

Ultrasound images of liver parenchyma and inferior vena cava (IVC) before and after the injection of microbubbles. A: 15 min after injection; B: 25 min after injection; C: 30 min after the injection; D: 40 min after the injection.