Figure 2.

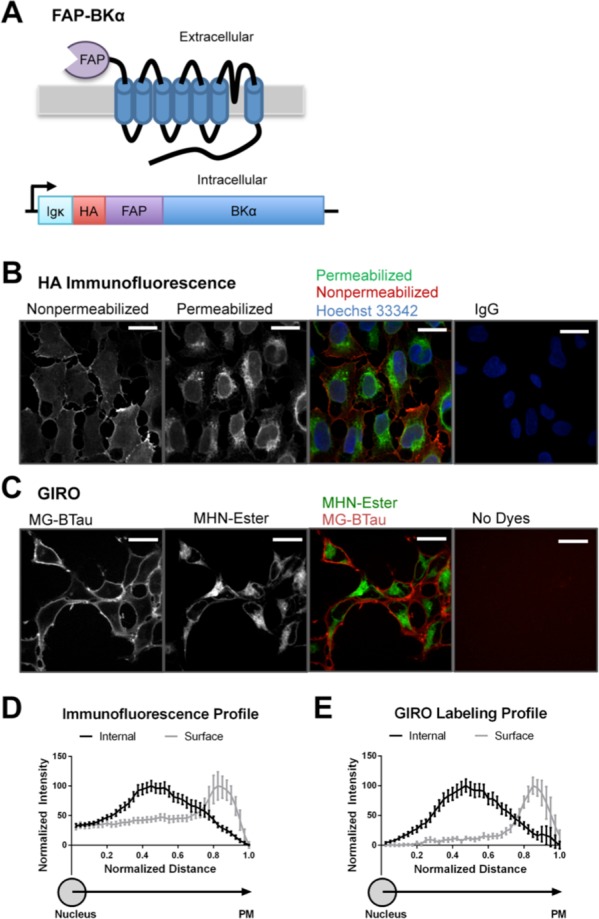
GIRO labeling recapitulates immunofluorescence methods. (A) Schematic of FAP-BKα construct showing protein topology and DNA configuration. An HA tag is included at the very N-terminus of FAP-BKα. (B) Immunofluorescence against HA without (red) and with (green) permeabilization to label surface and internal protein, respectively. (C) Live cells labeled with MG-BTau (red) and MHN-Ester (green) to label surface and internal protein in FAP-BKα expressing live cells. (D) Normalized profile plot for fixed cells quantified from nucleus to cell periphery (distance 0.0 corresponds to nuclear center; 1.0 is just beyond PM). Peak intensities are at 0.42 for internal and 0.81 for surface labeling. (E) Cumulative profile plots for dye-labeled live cells. Peak intensities are at 0.44 for internal and 0.82 for surface labeling. Profile plot distance bins are average pixel values. n = 25 cells from 3 experiments for each condition. Scale bars = 40 μm.
