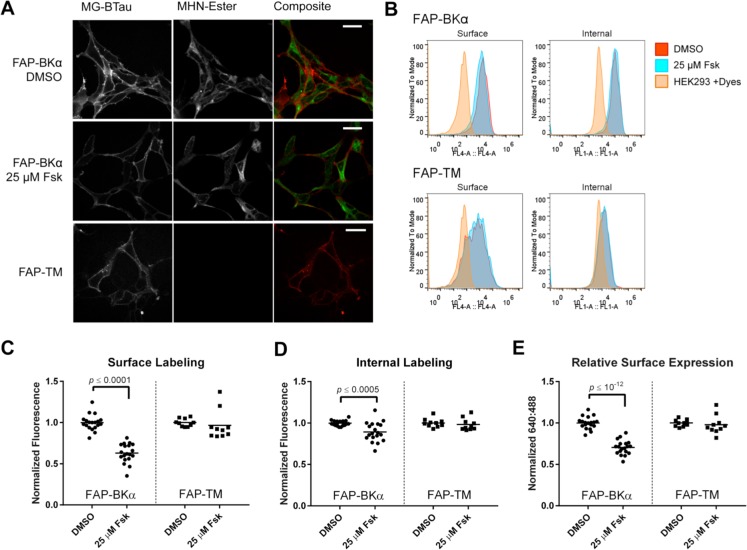
Figure 5.
Overnight forskolin application reduces surface level of FAP-BKα. (A) Representative microscope images of FAP-BKα stable cells treated with 25 μM forskolin or 0.1% DMSO overnight. FAP-TM expression is shown below; note the high surface expression without substantial internal labeling. Scale bars are 40 μm. (B) Representative flow cytometry histograms of FAP-BKα and FAP-TM surface and internal labeling with overnight fsk treatment. Nonexpressing cells run with dyes were used as a background control. Note the relative lack of MHN-Ester labeling in FAP-TM cells compared to FAP-BKα. (C) Quantification of median surface fluorescence for FAP-BKα and FAP-TM with fsk treatment (FAP-BKα = 62.9% of control, FAP-TM = 96.6% of control). (D) Median internal fluorescence for FAP-BKα and FAP-TM with fsk treatment (FAP-BKα = 89.2% of control, FAP-TM = 98.2% of control). (E) RSE for FAP-BKα and FAP-TM (FAP-BKα = 70.4% of control, FAP-TM = 97.9% of control). Samples were normalized to DMSO intensity for each experiment. n = 19 biological replicates from 7 experiments for FAP-BKα. n = 9 biological replicates from 3 experiments for FAP-TM. RSE was determined by (median MG-BTau)/(median MHN-Ester) for each sample. Error bars are ±95% confidence intervals. Significance was determined by Student’s t test with Welch’s correction. Significant p-values are shown.

