
Figure 1.
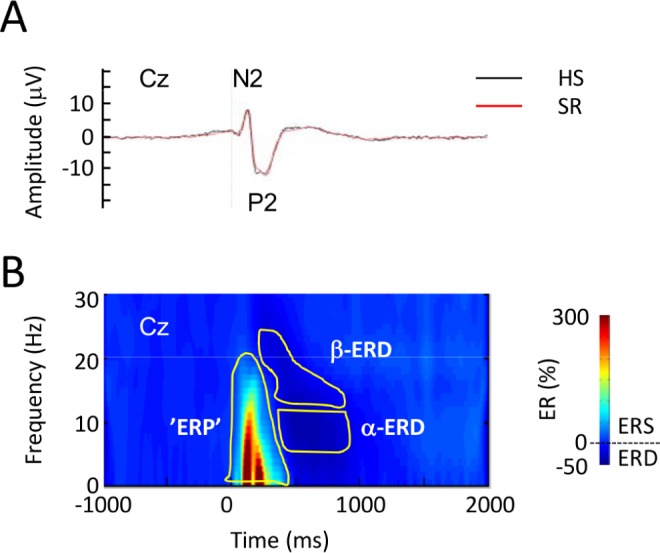
Group-level average event-related potentials elicited by high-density electrical stimulation. (A) Group-level average N2P2 potential after habitual sleep, (HS, black) and sleep restriction (SR, red) in the time domain. (B) Group-level average time-frequency representation of pain-elicited modulation of electroencephalographic oscillation magnitude (ER%). The color scale represents average increase or decrease of oscillation magnitude relative to a prestimulus reference interval (−0.9 to −0.1 sec) before the electrical stimulus. Statistically defined regions of interest (ROI) used in the time-frequency analysis are shown in yellow. Responses are from recording position Cz, referenced to linked mastoid (A1A2). ERD, event-related desynchronization; α-ERD, ERD in the α-frequency range; β-ERD, ERD in the β-frequency range; ‘ERP,’ event-related potential ROI; ERS, event-related synchronization.