
Fig. 2.
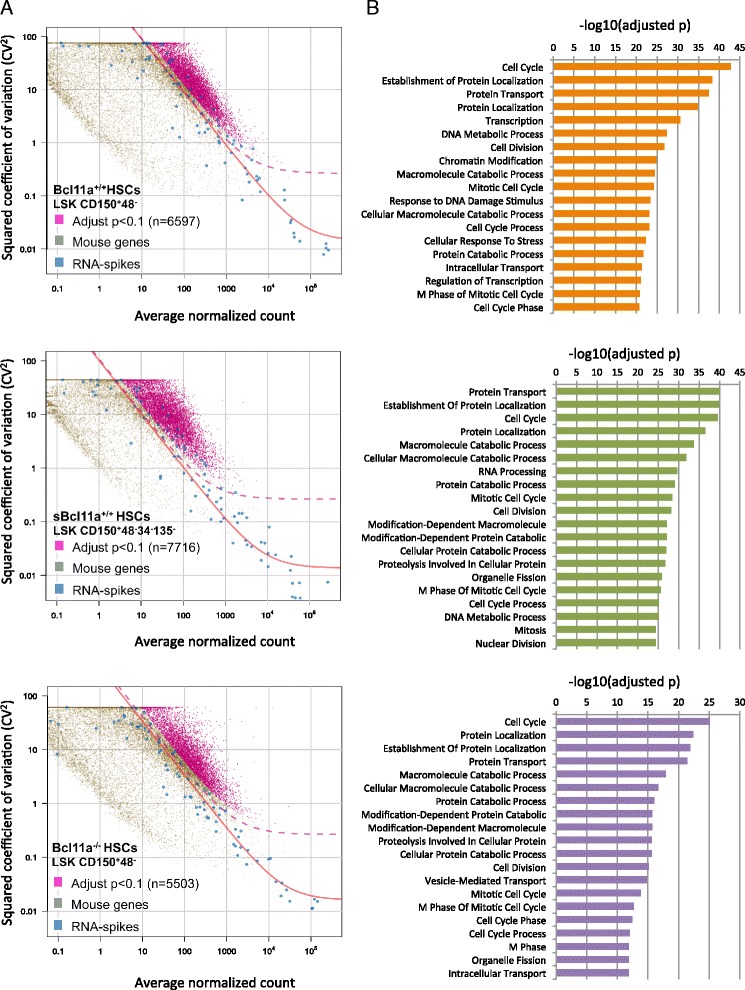
Identification of cell cycle activity as the dominant source of transcriptional heterogeneities in the HSC compartment. a Identification of highly variable genes in Bcl11a +/+ (upper panel), sBcl11a +/+ (middle panel) and Bcl11a −/− (lower panel) HSCs. The expression variability of individual genes measured by the squared coefficient of variation (CV2) is plotted against the mean expression level (normalized counts). Magenta points indicate mouse genes (Bcl11a +/+, 6597; sBcl11a +/+, 7716; Bcl11a −/−, 5503) showing higher than expected expression variability compared with external RNA spike-ins (blue) (adjusted p value <0.1). The red line is the fitted line of the spike-ins and the dashed line marks the margin for genes with 50 % biological CV. b The top 20 gene ontology terms enriched in the highly variable genes among Bcl11a +/+ (upper panel), sBcl11a +/+ (middle panel) and Bcl11a −/− (lower panel) HSCs. The p value was adjusted by the Benjamini and Hochberg method for multiple testing